


This is a detailed guide exploring reporting options in Piwik Pro Analytics. It gives you a head start on navigating each option and insights into how Piwik Pro integrates with your organization’s preferred dashboarding and reporting environment.
Reporting is a crucial feature in any analytics platform that helps collect and store data. Piwik Pro Analytics offers various reporting options, providing flexibility in leveraging data to create actionable business reports for multiple departments. Furthermore, it seamlessly integrates with your preferred business reporting tools or environments.

Image Credit By The Data School
Following data collection, the subsequent step typically involves analysing this data. This analysis is vital for data activation, a process that entails taking informed actions based on the insights derived from the data. For you to facilitate this, it is essential to interpret the data accurately to inform decision-making processes, primarily through the creation of reports.
This brief blog post intends to discuss the reporting options available to Piwik Pro customers, including the different Piwik Pro analytics reporting surfaces.
If you’re interested, let’s proceed.
Available Reporting Features and Options in Piwik Pro Analytics
I’ll start with listing the available options, followed by a brief overview of each option, which should help provide a starting point on what is possible and potentially guide you on approaching and utilising the listed options.
The options include:
- Piwik Pro Reporting Surfaces/Features (custom reports, dashboards, reporting API)
- Google Sheets
- Looker Studio
- Microsoft Excel
- Microsoft Power BI
- Tableau
Let’s walk through each option listed above.
Piwik Pro Reporting Surfaces (The Three Features)
Within the Piwik Pro Analytics suite, as a user, you have access to a range of reporting features that enhance the flexibility, ease, and collaborative potential of building analytics reporting in your organisation.
Key reporting features/surfaces in Piwik Pro Analytics Include:
- Custom Reports
- Dashboards
Piwik Pro also offers an “HTTP API” for reporting, which caters to reporting using custom reports and raw data.
Piwik Pro Custom Reports
The “Custom Report” feature, prominently located in the top header of the Piwik Pro Analytics suite, simplifies the creation of tailored reports. This report surface allows you to build reports that include the metrics and dimensions most relevant in communicating your insights with your team members, clients and stakeholders. This feature also enables you to utilise the report visualisation type of your choice.
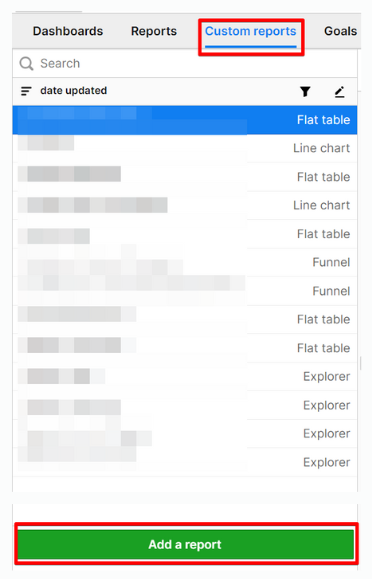
You can access this customisable reporting environment from the Piwik Pro Analytics suite by clicking “Custom Reports” in the analytics suite header.

Within the “Custom Reports” section, you’ll find default reports, any previously created reports, and the option to “Add a Report” for new custom analyses.
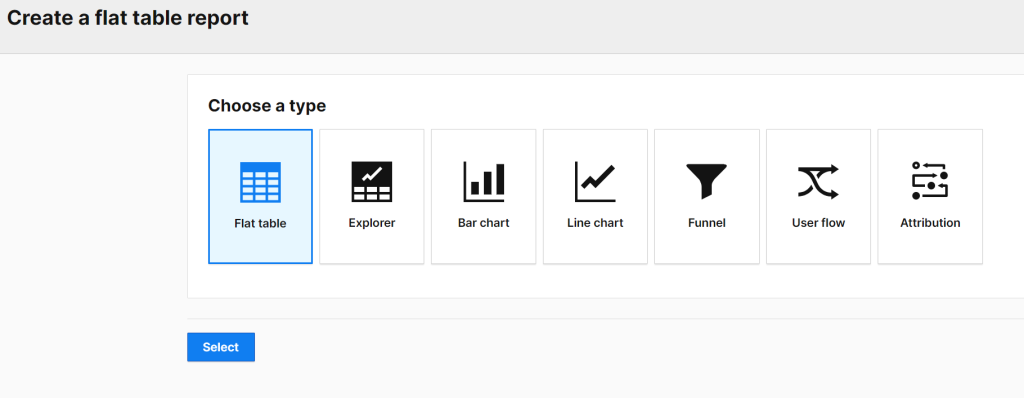
Here are the types of reports you can create
- Flat Table: This report is a standard table chart displaying dimensions and metrics without nesting capability.
- Explorer: This report type is a nested table chart of dimensions and metrics. It also includes a line chart that aids dynamic analysis.
- Bar Chart: A graphical representation with bars to facilitate easy data comparison.
- Line Chart: A graph that illustrates data trends over time.
- Funnel: A chart that outlines visitors’ steps towards completing a goal on your site or app, helping you identify and highlight potential drop-off points in your business funnel.
- User Flow: A visual map of a visitor’s journey through your site or app, showing visited pages and actions to identify improvement opportunities.
- Attribution: A report that evaluates the influence of different marketing channels or touchpoints on conversions and sales, aiding in optimising marketing budgets and tactics for better outcomes.
For further guidance on “Custom Reports,” reference the linked article or watch the Piwik Pro tutorial video playlist.
You can read my guide on building a Piwik Pro custom report that can help identify the domains you are collecting website traffic data on and provide high-level performance Insights on different business website domains you own.
As of the time of publication, Piwik Pro enables users to share custom reports with individuals who do not have access to the Piwik Pro Analytics property by making the report public. This feature enhances collaborative efforts, though it’s important to note that it is experimental and subject to changes or potential discontinuation, as the Piwik Pro team indicates.
Piwik Pro Dashboards
The primary function of Piwik Pro Dashboards is to enable the easy and rapid visualisation of data collected within your analytics property. This facilitates the collaborative communication of insights and the recommendation of business actions to be taken on the data.
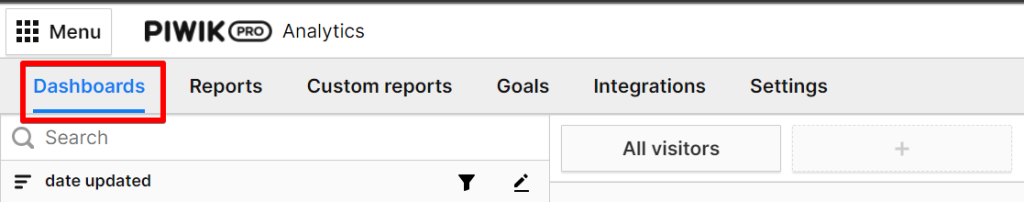
Accessing and creating a dashboard within Piwik Pro is clear. The “Dashboards” reporting interface is readily accessible via the Analytics suite headers.
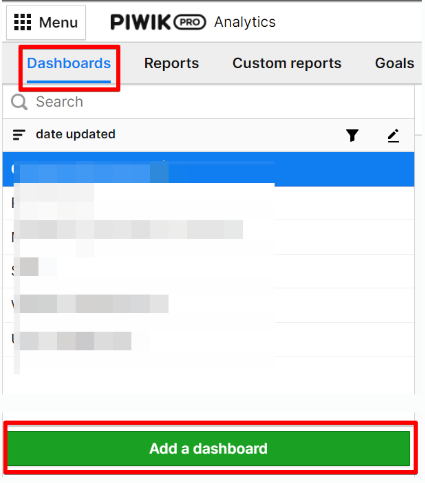
Upon navigating to the “Piwik Pro Dashboards” interface, you’ll get shown several default dashboards that come with every initial setup. Click the “Add New Dashboard” button to create a new dashboard.
To create and manage a dashboard in Piwik Pro Analytics, you must possess one of the following access permissions types: owner, manage, edit & publish, or edit.
Upon clicking the add a new dashboard button, you will see a screen to input the dashboard name and set its visibility, determining who can access it.
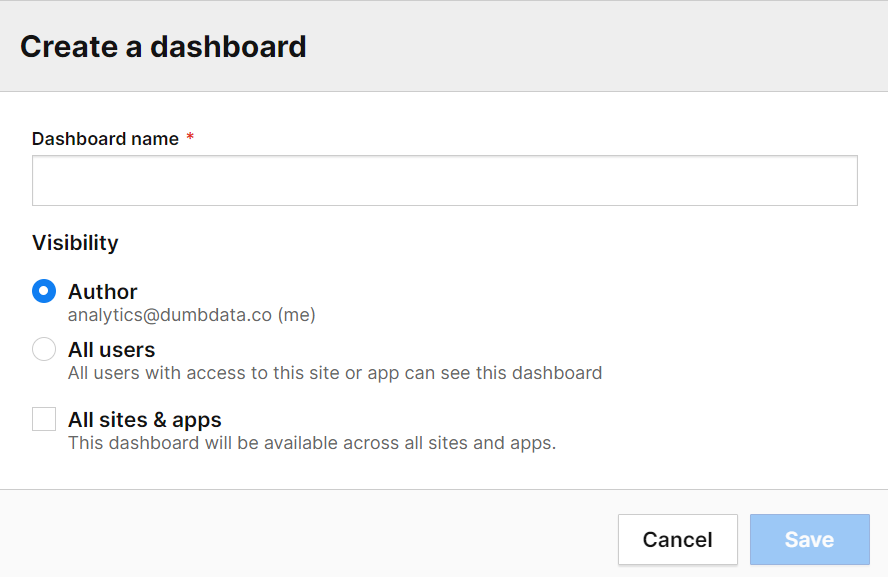
You can have this accessibility configuration modified anytime, plus you can also decide if you want to have the dashboard repurposed across other Piwik Pro sites under your account.
The dashboard building interface permits the addition of various widgets, which are the chart components constituting the dashboard, and these widgets are;
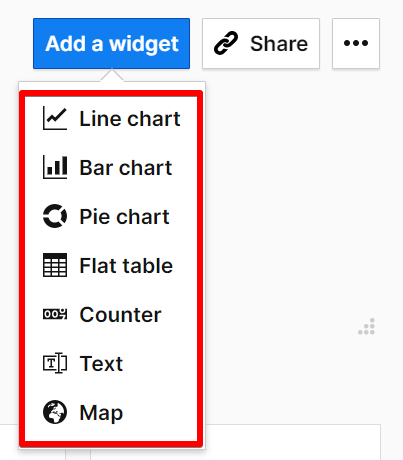
- Line Chart
- Bar Chart
- Pie Chart
- Flat Table
- Counter
- Map
- Text (ideal for enhancing communication and providing valuable data descriptions)
Piwik Pro Dashboards offer the flexibility to focus on metrics and reporting structures you and your team understand.
For a comprehensive guide on building a Piwik Pro dashboard, refer to the resource linked here or watch the embedded YouTube video the Piwik Pro team produced.
Piwik Pro Reporting HTTP API
Another reporting feature that doesn’t live within Piwik Pro (but works with some internal configurations) is the Reporting HTTP API, which facilitates exporting raw and aggregated analytics data. This capability enhances the versatility of data handling and analysis.
Utilising this reporting feature necessitates authentication to access various endpoints. These endpoints enable data extraction from your Piwik Pro Analytics property, offering seamless data retrieval for reporting purposes.
The highly customisable API offers extensive flexibility to meet specific data analysis needs. Further details are available here, which have more complete information and guidance on utilising the Reporting HTTP API of Piwik Pro Analytics.
Google Sheets (How It Integrates With Piwik Pro)
Google Sheets remains a widely utilised tool for reporting and sharing insights across business teams. Integrating Piwik Pro Analytics analytics with Google Sheets can make analytics reporting collaborative efforts and data communication.
This integration offers the flexibility to work with raw or aggregated report data, allowing for a tailored approach to exporting your analytics data into Google Sheets.
When loading data from Piwik Pro Analytics to Google Sheets, the required access permissions include one of the following: owner, manage, edit & publish, edit, or view.
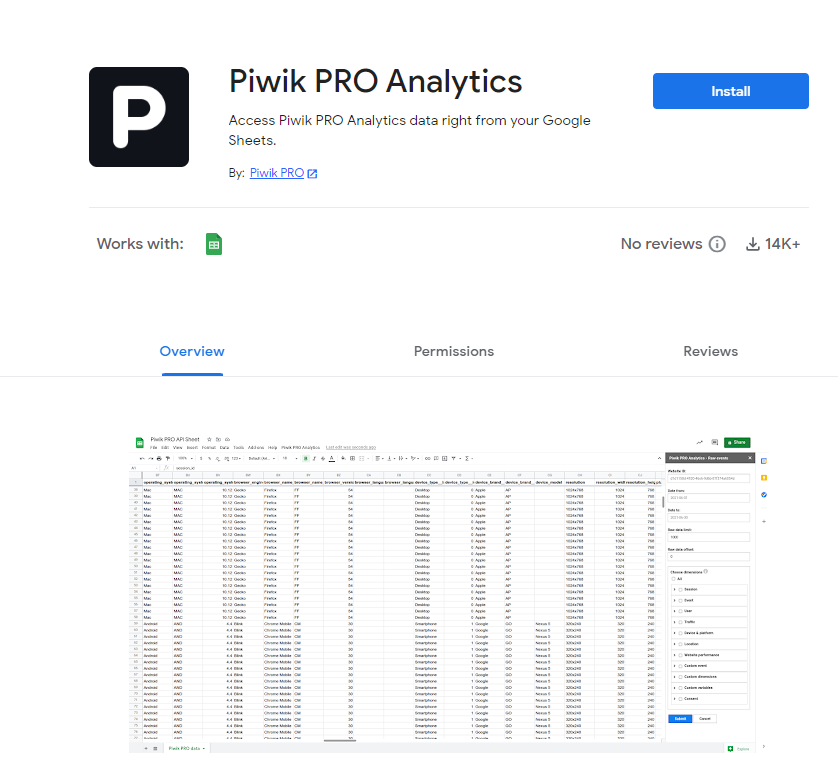
Two prominent methods for integrating Piwik Pro analytics data with Google Sheets are through Piwik Pro’s native Google Sheets connector or by using Supermetrics. Both avenues provide a significant level of reporting depth and robustness.
Refer to this exhaustive article for detailed instructions on integrating Piwik Pro and Google Sheets using the abovementioned methods and extra tips that you’ll find helpful.
Looker Studio (How It Integrates With Piwik Pro)
Dashboards serve as an interactive reporting method of presenting various forms of visual data, aiming to convey actionable insights you’ve collected in Piwik Pro. These insights are instrumental in guiding informed business decisions.
For businesses that have adopted Looker Studio for dashboard creation and data visualisation, integrating Piwik Pro as a data source is seamless and possible. Piwik Pro’s compatibility with Looker Studio ensures that users can easily pull collected analytics data into their dashboards without hassle.
To facilitate the integration between Looker Studio and Piwik Pro, users must possess one of the following levels of access permissions: owner, manage, edit & publish, or edit.
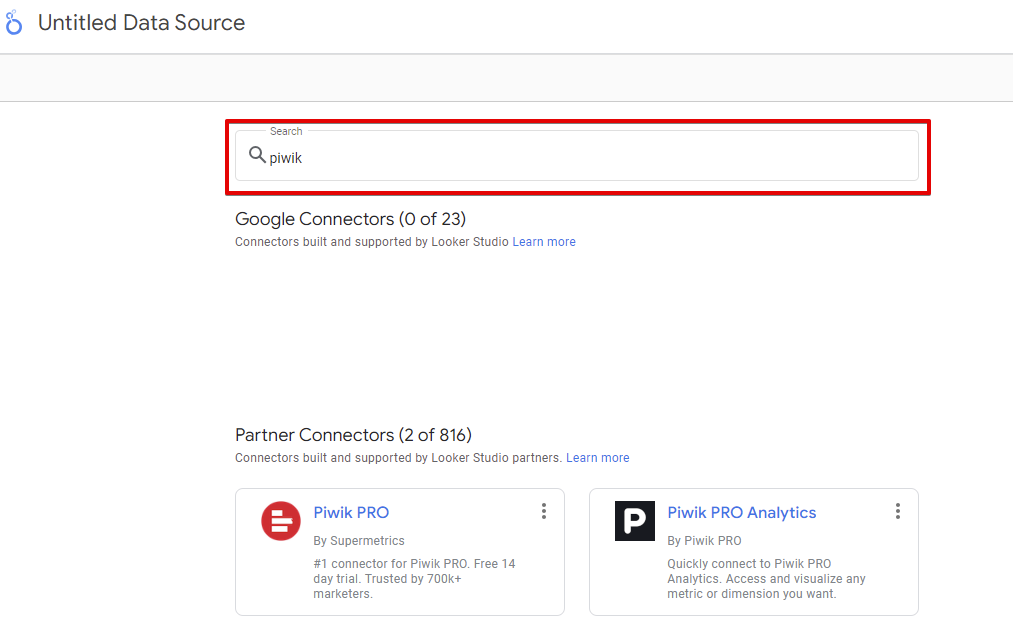
There are several methods to achieve integration between Piwik Pro and Looker Studio. Users can opt for the native Piwik Pro Looker Studio connector or utilise Supermetrics for smoother data integration.
Additionally, for Funnel.io customers, custom integration is available for Funnel.io customers to import Piwik Pro analytics data into Funnel.io, which can subsequently get synced into Looker Studio or whatever BI tool of your choice.
This article provides a step-by-step guide on connecting Piwik Pro with Looker Studio, which covers Piwik Pro’s native integration and the Supermetrics approach.
Microsoft Excel (How It Integrates With Piwik Pro)
Microsoft Excel remains a staple tool for reporting and sharing insights within many organisations. If your organisation relies on Excel for reporting, rest assured that transitioning away from Excel is unnecessary when reporting Piwik Pro analytics data to your business stakeholders. Here, I will outline the options for integrating Piwik Pro analytics data into Excel.
While there is no direct native integration between Piwik Pro and Microsoft Excel, exporting your analytics data to an Excel spreadsheet is feasible and achievable automatically (dynamic) or manually.
The automated approach ensures that your Excel spreadsheet gets regularly updated with the new data collected in Piwik Pro analytics without any extra manual effort. On the other hand, the manual approach requires you to update your Excel rows or re-upload the data yourself manually.
Manual data export involves exporting a report in Piwik Pro, either a custom report or a standard report, and then exporting it in CSV file format.
The main drawback of the manual method is the need for frequent updates to the dataset in your Excel spreadsheet. To streamline this process, consider the following automated solutions:
Here is an automatic approach to integrating Piwik Pro and Microsoft Excel.
Using Supermetrics:
Supermetrics allows for the extraction of data directly into an Excel spreadsheet, which is then automatically updated as Piwik Pro Analytics collects new data. This tool offers flexible options for utilising your Piwik Pro analytics data.

Using The Reporting API:
You can also leverage Piwik Pro reporting HTTP API to schedule exports of analytics data from API to Microsoft Excel using tools such as Coupler.io, Streamlit or other applications that support this use case.
Another automatic method non-Supermetric customers can consider will be to first automatically export the Piwik Pro Analytics data into Google Sheets, perform any necessary data manipulation, and then dynamically export it to Excel, using any of the solutions below.
Note that this alternative still brings Google Sheets into the picture.
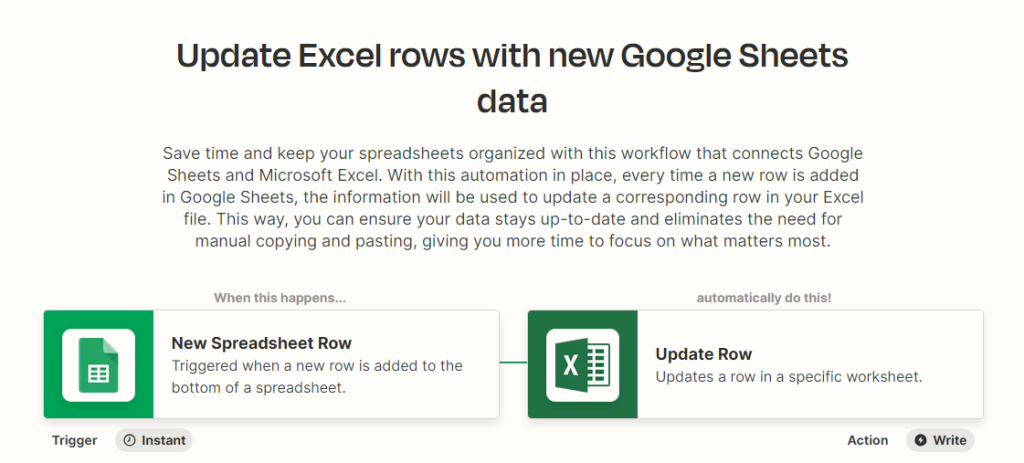
Using Zapier:
Zapier can automate the process by linking your existing Excel spreadsheet with a Google Sheet used in currently pulling data from Piwik Pro. Using Zapier ensures that the Excel spreadsheet will automatically update as new rows get added to the Google Sheets.
For further direction on this approach, more information is available here.
Using SheetsGo:
Similarly, SheetsGo offers automation capabilities. With its integration, your Excel spreadsheet can remain current with data collected in the Google Sheets that you’ve connected to Piwik Pro.
This documentation provides insights on leveraging SheetsGo for data updates.
Be aware that Zapier and SheetsGo may introduce additional operational costs if you are not already utilising these solutions. However, they can significantly streamline your reporting process and reduce the time spent on manual tasks for individuals who want to report on Piwik Pro Analytics data in Microsoft Excel.
Now, you can see what is achievable with reporting your Piwik Pro analytics data in a Microsoft Excel spreadsheet.
Microsoft Power BI (How It Integrates With Piwik Pro)
Microsoft Power BI is a business intelligence tool for interactive reporting and dashboard creation. Numerous organisations use it for its data visualisation capabilities.
Piwik Pro seamlessly integrates with Power BI, which means you can still dashboard and report on your analytics data using Microsoft’s BI tool to enhance your businesses’ analytical and reporting/dashboarding operations.
As of the time of writing, integrating Piwik Pro with Power BI requires manual addition of the Piwik Pro and Power BI extension. This integration is in beta and has not yet been officially listed among the Microsoft Power BI extensions.
It’s vital to ensure you have the appropriate permissions before integrating these two analytics tools. The necessary permissions include one or more of the following: owner, manage, edit & publish, edit, or view.
Alternative Integration Methods with Supermetrics and Google Sheets
For those utilising Supermetrics, a streamlined method exists to dynamically and automatically export Piwik Pro analytics data directly into Microsoft Power BI. This approach simplifies the process of data integration and manipulation, allowing for real-time updates and comprehensive analytics insights.
Another viable option involves using Google Sheets as an intermediary. By first collecting your Piwik Pro analytics data in Google Sheets, you can then easily connect this data set to Power BI. This method facilitates the creation of detailed dashboards tailored for business stakeholders, internal teams, or clients, leveraging the strengths of both Google Sheets and Power BI for enhanced data analysis and reporting.
These integration options underscore the versatility and interoperability of Piwik Pro analytics with Microsoft Power BI, offering businesses powerful tools for data-informed decision-making and insightful reporting.
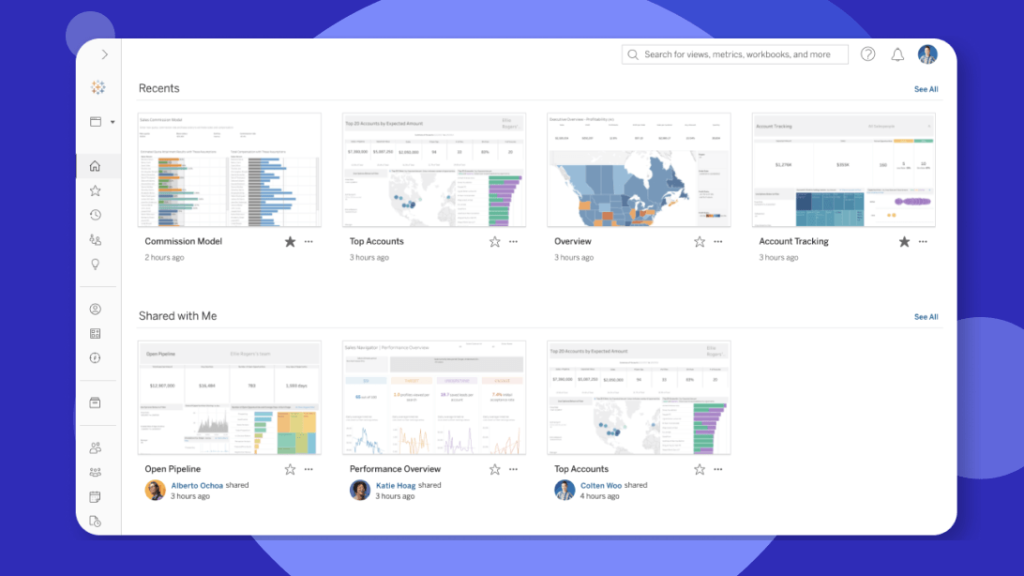
Tableau (How It Integrates With Piwik Pro)
Tableau is a prominent business intelligence tool renowned for its sophisticated dashboarding capabilities. For organisations that prefer utilising Tableau for their business reporting needs and are hesitant to switch to Looker Studio or Microsoft Power BI, integrating Piwik Pro Analytics with Tableau is possible.
Note that there is no direct native integration between Piwik Pro and Tableau. However, you can leverage the Piwik Pro integration with Google Sheets as an intermediary to store the data, subsequently connecting it to Tableau for analysis and visualisation.
Here is a detailed guide that explains how you can integrate Google Sheets and Tableau, which provides a pathway for users to export their data to Google Sheets and ensure it remains current through automatic updates.
For those utilising the Piwik Pro enterprise plan with an existing configuration for BigQuery integration, an alternative approach involves connecting your BigQuery database directly to Tableau. This method enables the utilisation of the Piwik Pro analytics data exported to Google BigQuery to create an actionable dashboard in Tableau.
Final Thoughts on Piwik Pro Reporting Options
By now, you should clearly understand the diverse reporting options available within Piwik Pro Analytics. I hope this review has touched on the various pathways through which you can harness your Piwik Pro analytics data for more informed decision-making.
If you would like to read more exciting articles on Piwik Pro, then you should check out the following content works;
- How to integrate Piwik Pro and Google Consent Mode v2 without using Google Tag Manager
- If you’re using GTM, you can check out this piece that explains how Piwik Pro Consent Manager (CMP) can be integrated with Google Consent Mode in Google Tag Manager.
- Detailed guide on understanding how to debug your Piwik Pro setup
- How to identify and fix [13] Piwik Pro eCommerce reporting and tracking issues
- How to redact PII in Piwik Pro Analytics
- Conversion Tracking Piwik Pro (Also known as Goals)
You can also check the DumbData blog for more Piwik Pro reads and analytics content on Google Analytics (GA4), Microsoft Clarity, Looker Studio, Big Query and Mixpanel.
I’m eager to learn about your current reporting practices and any new methods you are considering exploring. Your feedback is invaluable, and I encourage you to share your experiences or questions. Feel free to connect with me through email on the DumbData Contact Us page or on LinkedIn.
Blog Post Cover Image Credit Source:
Pre-historic drawings and engravings in cave walls (Photo by Rachel Claire on Pexels.com)