

This is a comprehensive, in-depth article that extensively covers the various debugging options available in Piwik Pro Analytics. You will become familiar with the debugging tools and learn how to utilize them effectively. It provides insights into innovative use cases, limitations, advantages, disadvantages, and much more, concluding with a valuable tip for effective debugging in Piwik Pro.
You’ve integrated Piwik Pro Analytics into your website. Perhaps you’ve encountered issues with your data collection due to a faulty or misconfigured instrumentation setup, or you’ve transitioned from a different analytics solution to Piwik Pro suites.
Your pressing questions might revolve around verifying if the Piwik Pro tracking script is correctly installed on your website, ensuring the accuracy of your event implementation, or identifying and rectifying any setup flaws.
Fear not, for you are in capable hands. This article will comprehensively explore the array of options at your disposal for debugging your Piwik Pro setup.
Before delving into the details, let me introduce you to the FREE Piwik Pro Analytics event and conversion tracking documentation worksheet that you can find in our DumbData resource hub. We’ve specifically designed this worksheet to keep your team well-organised, assist in planning your Piwik Pro event and goal instrumentation efforts, and foster collaboration throughout the instrumentation and setup management process.
Whoops, now that is out of the way.
It’s essential to recognise that debugging is an indispensable skill for anyone working in the realm of data, mainly if your focus is on data collection via web analytics tools and tag management solutions. This skill set requires you to don the hat of an investigator, akin to the legendary Sherlock Holmes. It equips you with the ability to identify issues in your data collection, pinpoint where errors occurred, and provide insights into how to rectify them.
Having been a user of Piwik Pro for several years, I can confidently attest that when it comes to debugging, you have a plethora of options at your disposal. In this extensive yet captivating blog post, I will meticulously explore each of these options, discuss their respective advantages and disadvantages, and demonstrate how they can prove invaluable in debugging your Piwik Pro analytics instrumentation.
Now, let’s delve into the available options:
- Analytics Debugger By David Vallejo
- Piwik Pro Tracker Debugger
- Piwik Pro Debug Mode
- WASP Inspector Extension
- Browser Developer Tools (Network Debugger, Console, Element Inspector, etc.)
- The Other Buckets (Tag Explorer, Omnibug, Analytics Inspector, and Observe Point)
- Google Tag Manager (helpful in some cases)
Now that you have understood the available options for Piwik Pro users let’s delve into each debugging tool, exploring its capabilities, recognising any limitations, and learning where to locate and utilise them.
As you continue reading, I’ll share my most effective debugging tips, unveiling a multitude of possibilities for troubleshooting.
Analytics Debugger by David Vallejo:
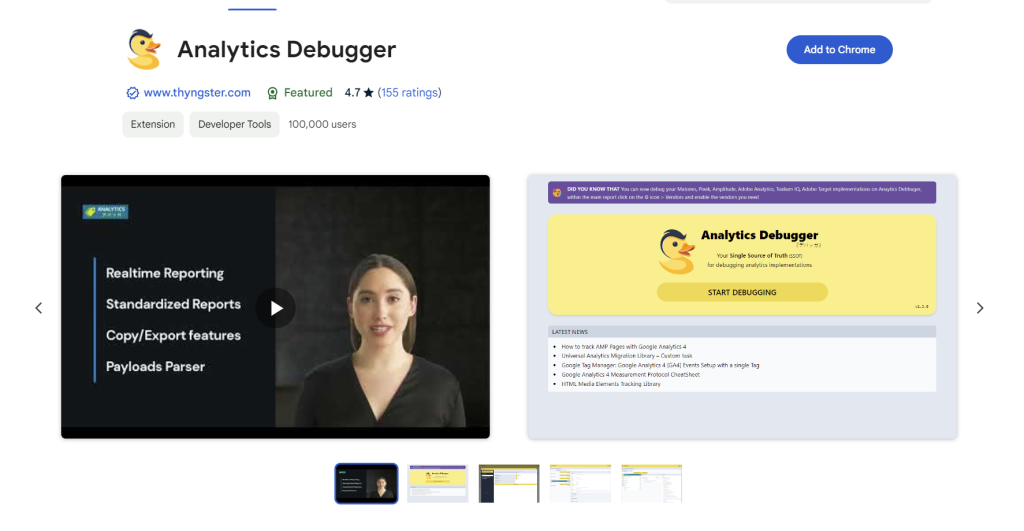
One tool that holds a special place in my toolkit is the Analytics Debugger, a Chrome extension built by the esteemed great David Vallejo. This invaluable Chrome extension is a versatile solution for debugging various analytics tools. I’ve noticed how it receives frequent updates, brimming with new features, design enhancements, and bolstered security.
The tool was previously known as “GTM/GA Debugger,” As soon as the extension transformed, starting with David adding debugging support for various MarTech and analytics vendors, which led to it getting renamed “Analytics Debugger.”
If you already don’t have this tool added to your Chrome browser, you can find it within the Chrome Web Store with this link and seamlessly add it to your browser.
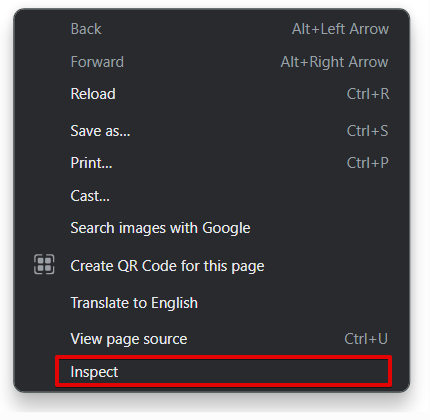
Upon adding the extension to your browser, accessing and utilising it is a straightforward process. Simply open the Chrome browser inspector tool by pressing “Control + Shift + I” (for Windows) or by right-clicking on the web page and selecting the “inspect” option. Mac users can access it with “Command + Option + I.”
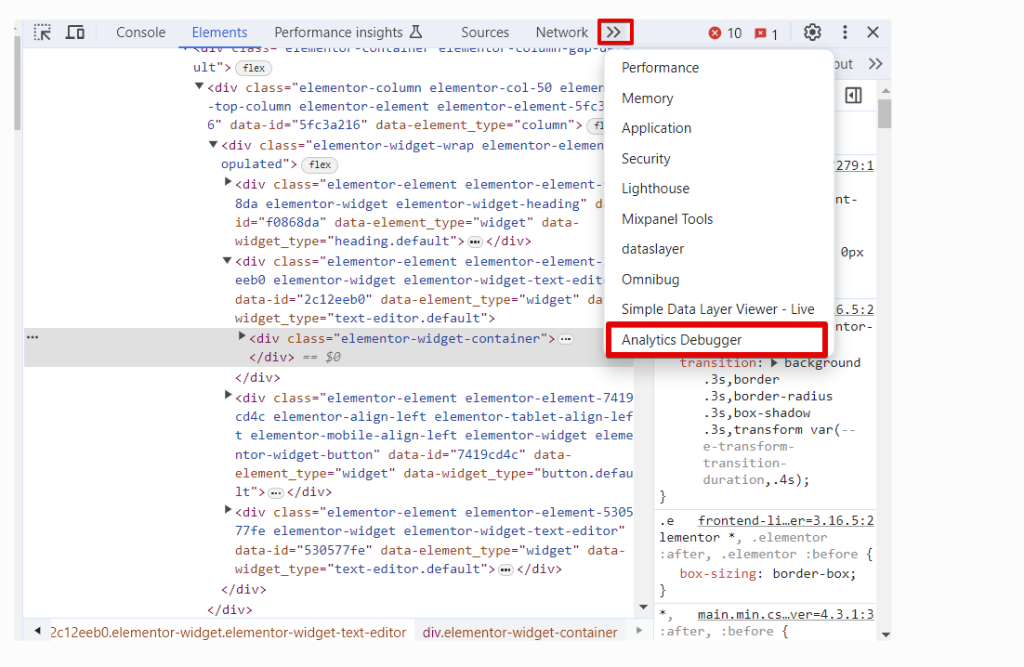
Upon opening the inspector, you should spot a tab labelled “Analytics Debugger.”
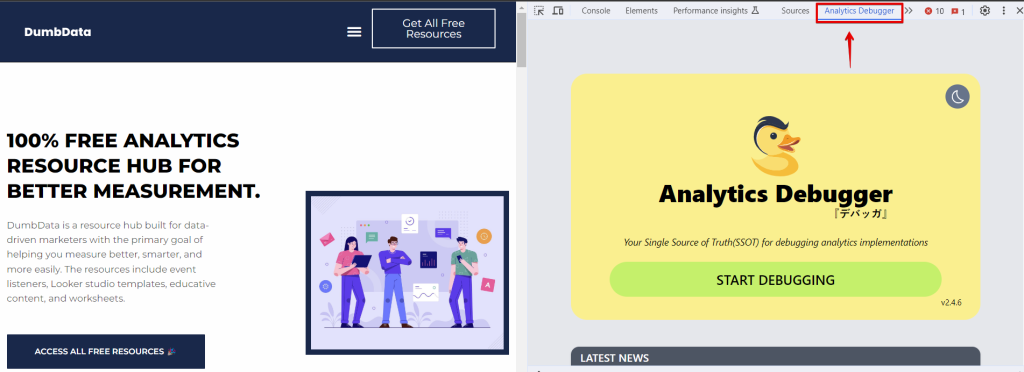
If it’s not immediately visible, expand the tabs option by clicking the double arrow icon and then select the “Analytics Debugger” option.
This extension allows you to toggle between dark and light modes by clicking the moon or light icon. Please don’t fret; I’ll delve into some of the extension’s settings shortly.
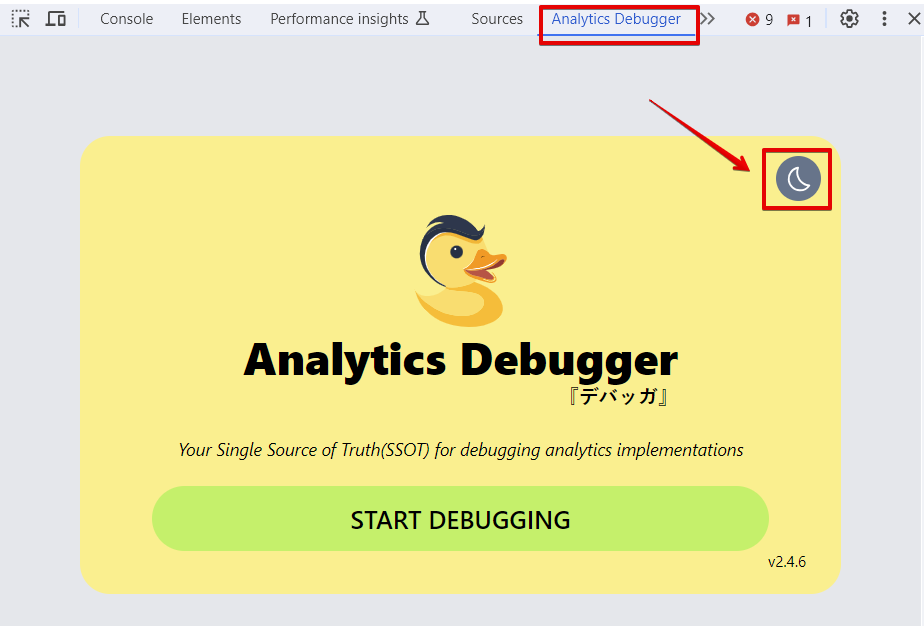
To initiate the debugging process, click the “Start Debugging Process” button, which will subsequently reload your web page.
A pro tip: For a seamless experience, consider docking the Chrome developer tools in a separate window. You can achieve this by clicking the three-dotted menu icon and selecting the “Undock to a separate window” option, as illustrated below. That’s if you’re using an extra screen connected to your laptop.
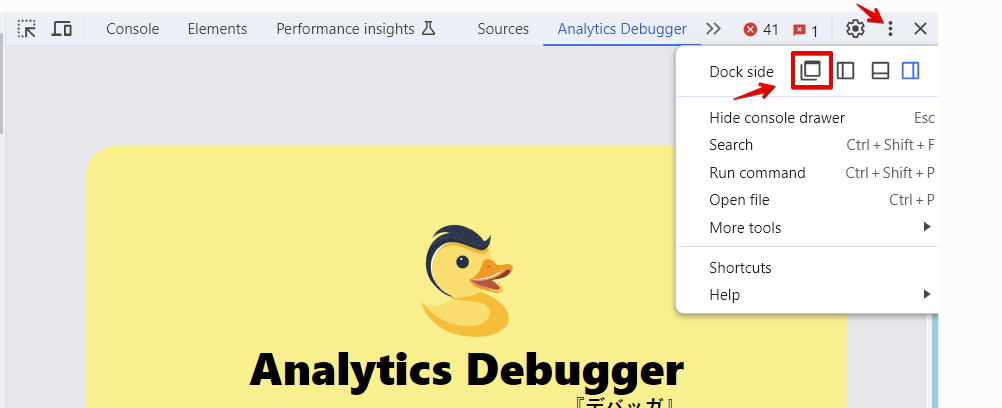
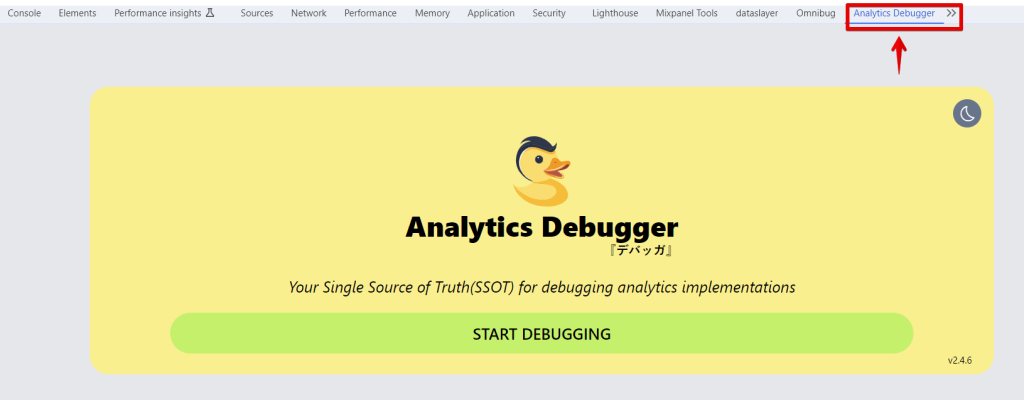
It provides a separate window interface for an enhanced debugging experience.
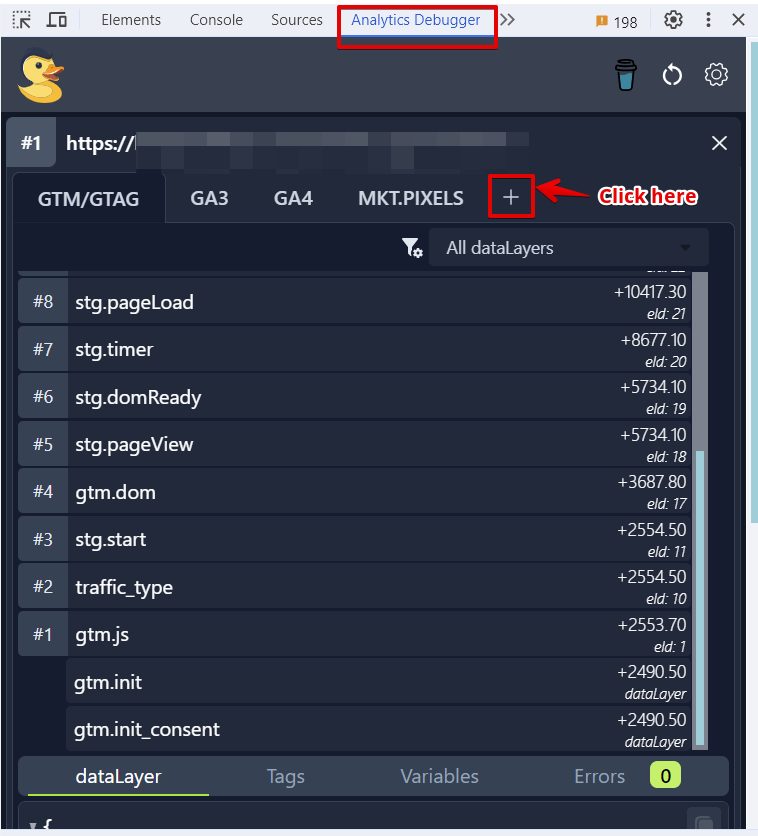
To further utilise this tool for debugging your Piwik Pro analytics setup, you must enable the Piwik Pro vendor, as demonstrated in the image provided. Don’t worry; you’ll shortly learn how to do this if you haven’t.
If you encounter difficulties locating it, follow these steps: Click the “plus sign,” which will direct you to the “Vendors” tab within the “Settings” view.
Find and select the “Piwik Pro” vendor within this list.
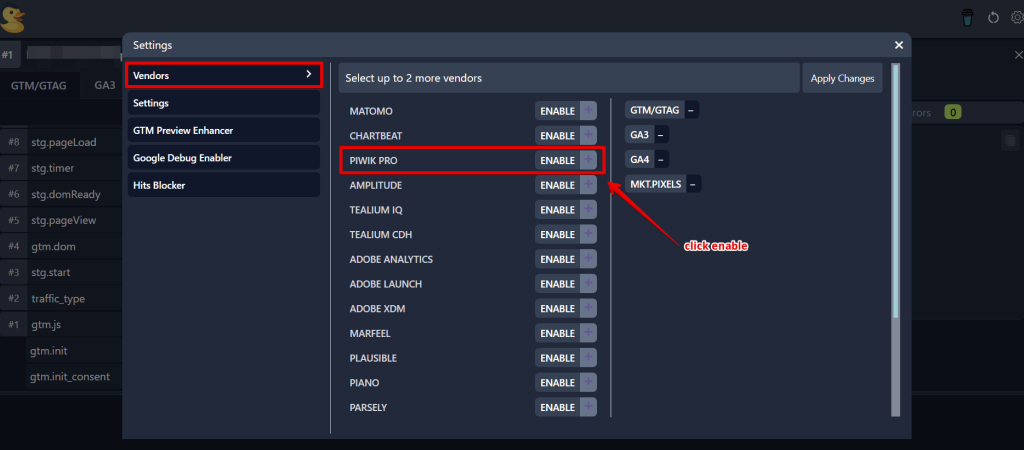
Once you’ve selected it, you’ll notice it appear on the right side, and the following action should be to click “Apply Changes.”
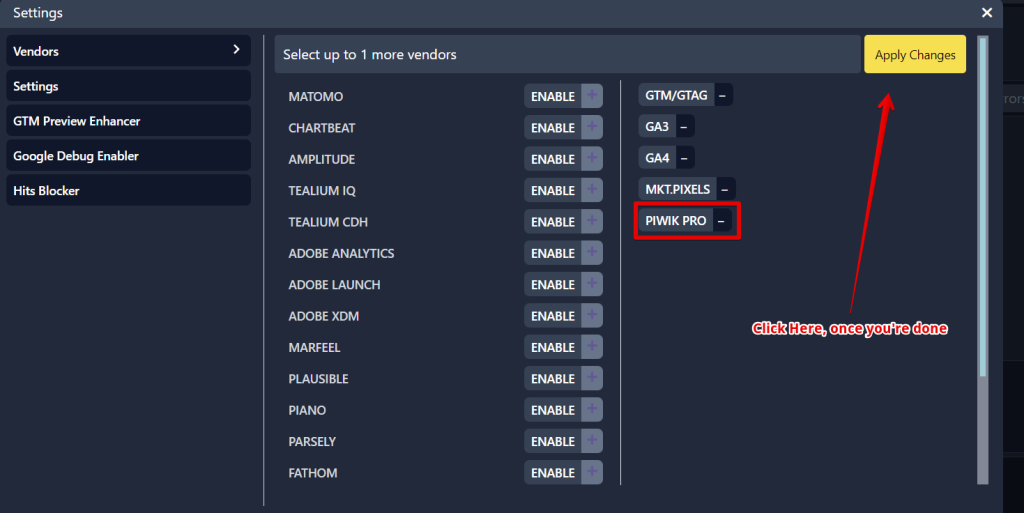
This action will trigger a tool reload, bringing you back to the initial screen, where you’ll need to click the “Start Debugging” button again.
Pro Tip: If you are unable to select the “Piwik Pro” vendor, it indicates that you’ve reached the maximum number of vendors allowed for debugging, which is capped at six. To enable “Piwik Pro” for debugging, you’ll need to remove one of the existing vendors.
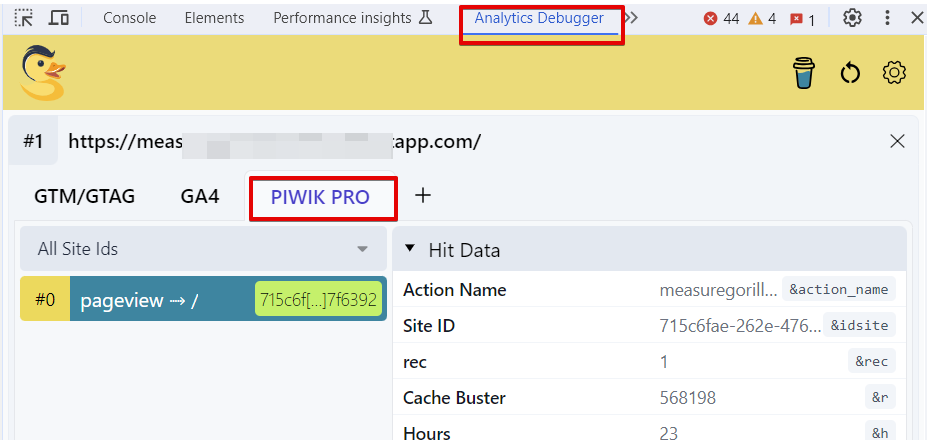
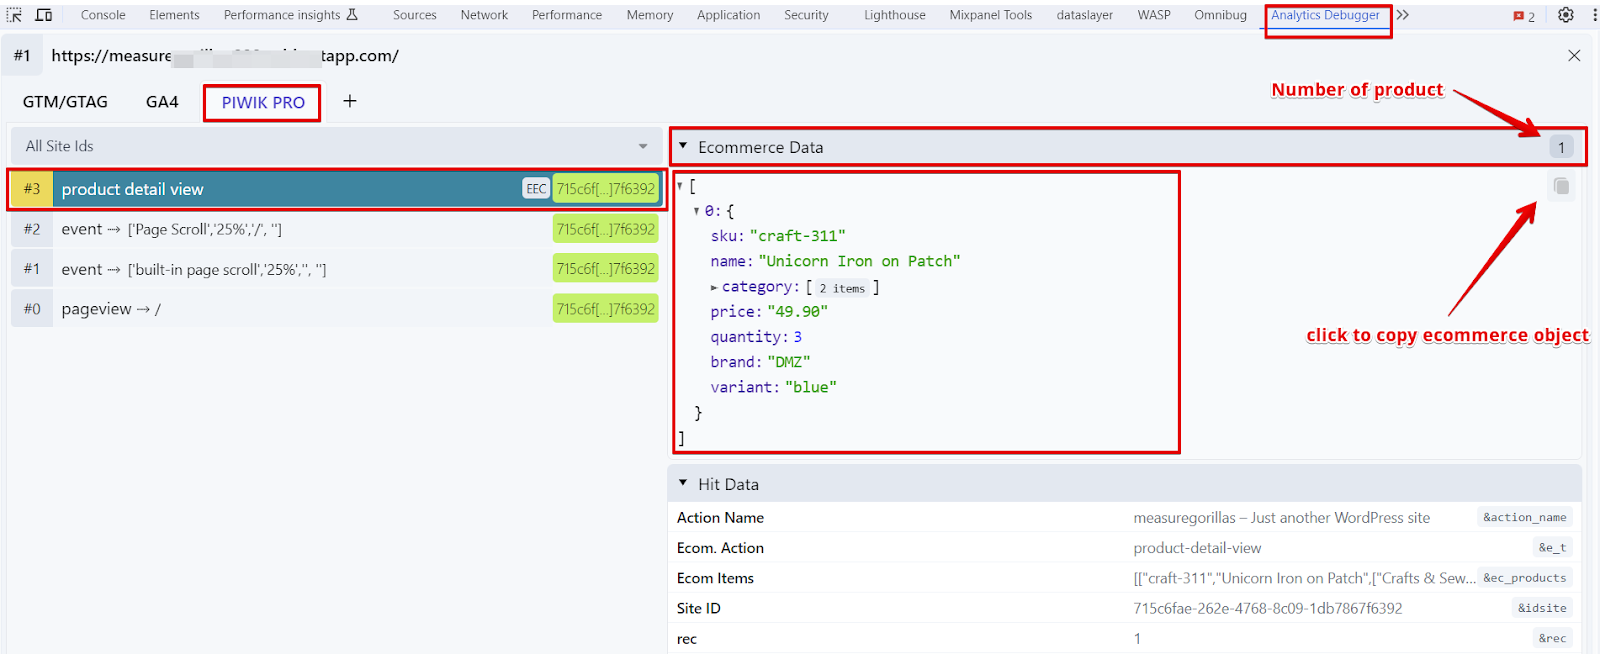
Upon the page reload, either through an automatic or manual refresh of the web page, navigate to the “Piwik Pro” tab within the debug view of the tool.
Here, you will gain insights into the Piwik Pro request flow presented in a table format. This table consists of two columns, with the left column representing the hit name and the right column providing details of the Piwik Pro hit. This information is further subdivided into the following sections:
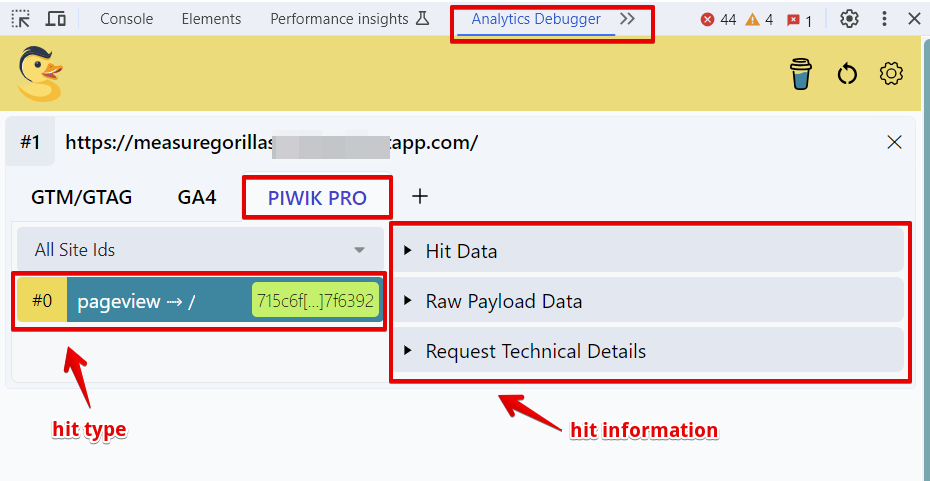
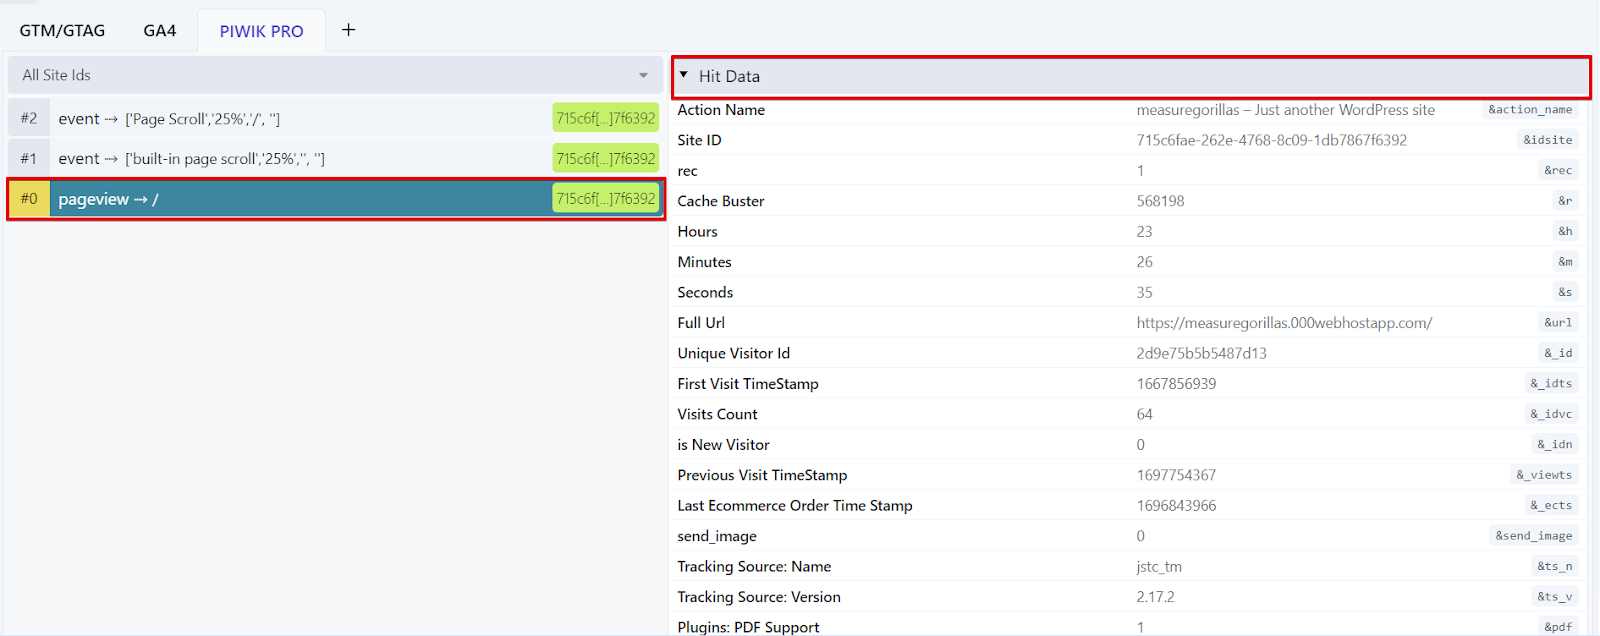
- Hit Data: This section uses plain and understandable English to convey comprehensive information about the Piwik Pro hit, an HTTP request sent to your Piwik Pro analytics server.
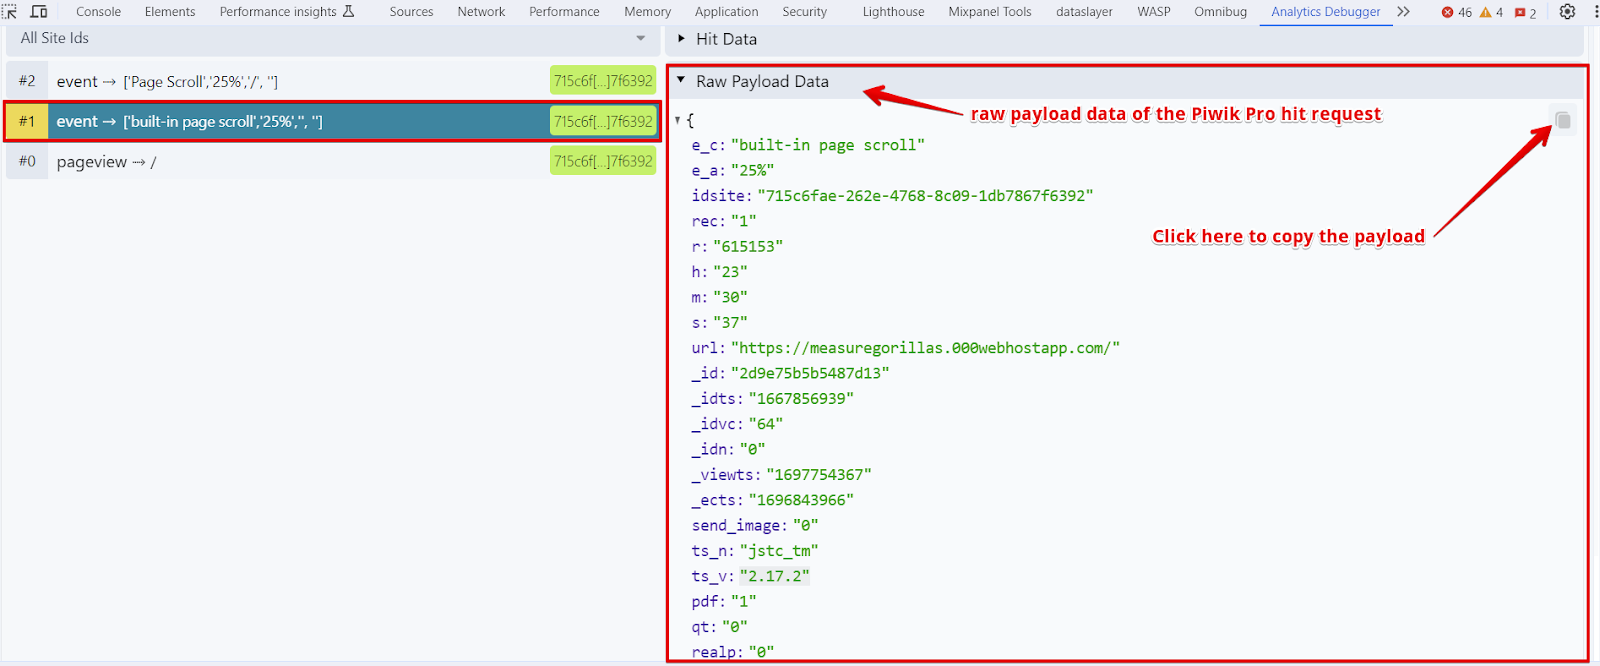
- Raw Payload Data: Here, you’ll be presented with the Piwik Pro request payload in its raw format, consisting of hit parameters in a non-layman form. You can conveniently copy the payload by clicking the copy icon at the top.
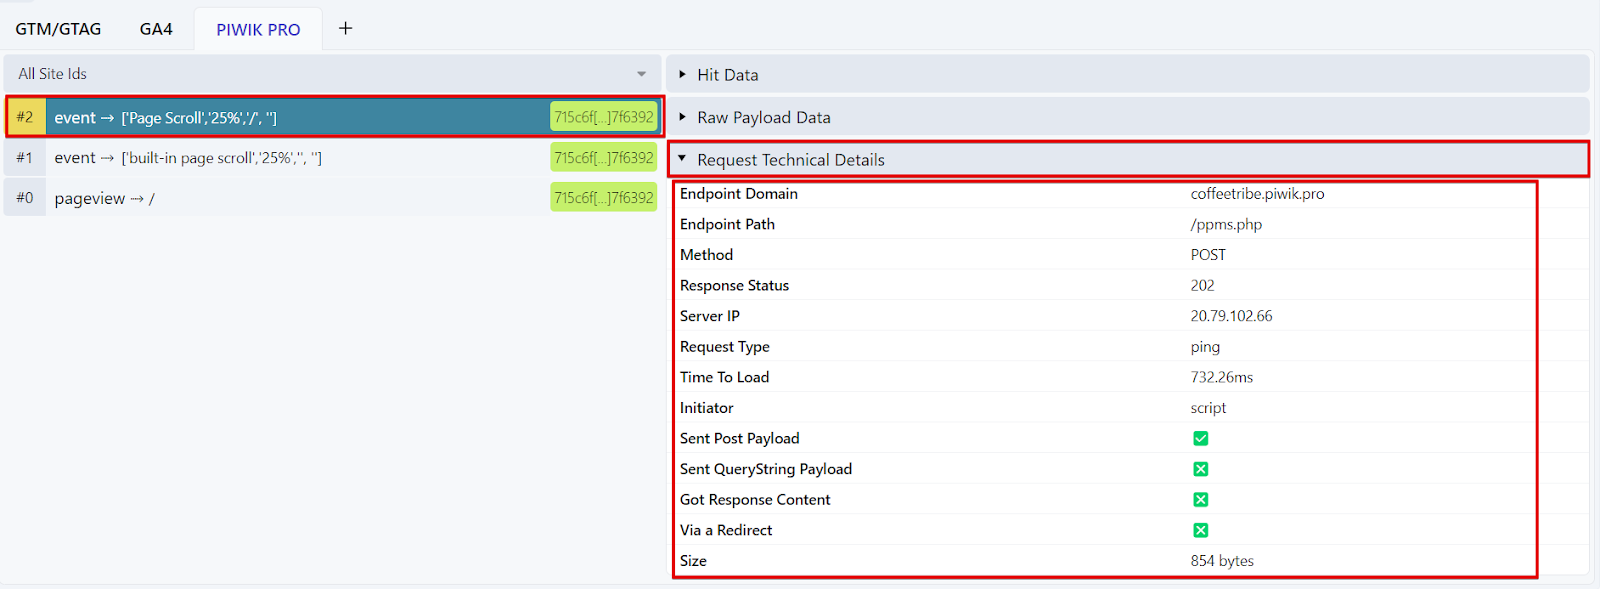
- Request Technical Details: This section provides technical details related to the HTTP request, such as information about your Piwik Pro instance, response status, endpoint path, size, etc.
- E-commerce Data (if applicable): In the case of an e-commerce action hit, this section supplies pertinent data concerning the product or e-commerce transaction.
Here is an insightful resource that helps identify 14 Piwik Pro e-commerce tracking issues with their respective solution. If you don’t set up Piwik Pro e-commerce tracking, you can use this e-commerce tracking recipe.
Here are some key considerations:
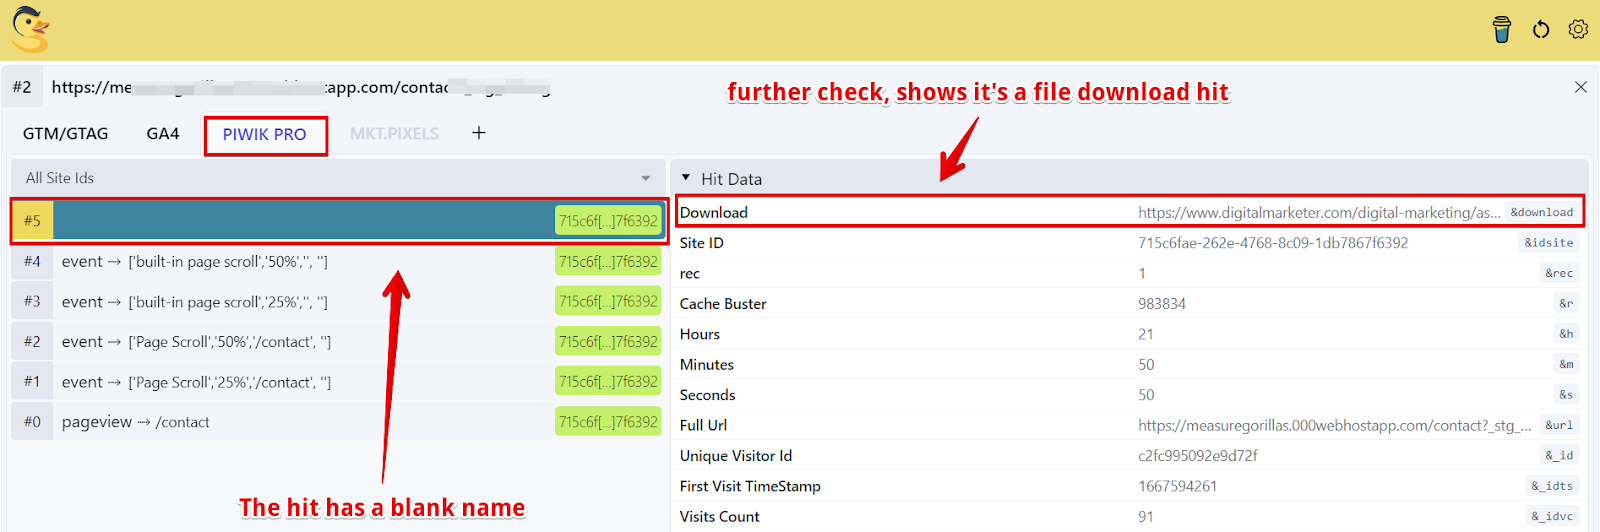
- Automatic Request File Downloads: It’s important to note that events related to automatically tracked file downloads do not display a request name; they may appear with a blank name. However, examining the request hit data will reveal that these are Piwik Pro file download event hits.
- Search Events on Page Load: You may not find Piwik Pro requests for search events that occur during page load. To check if such events have occurred, you can use the Piwik Pro tracker debugger, a tool I’ll cover shortly. However, if the search event isn’t tracked during page load and is instead triggered using the Piwik Pro JavaScript API, you’ll see the search event request with a labelled name in the Piwik Pro request.
- Limitations With Session Scope Dimensions: The tool can help identify which event-level custom dimension was applied during data collection. However, it has limitations when it comes to detecting the application of Piwik Pro’s session-scoped custom dimensions, as I couldn’t see any of my applied session custom dimensions. I’ll show you how to debug this in the next tool.
Now, let’s explore other settings within the Analytics Debugger:
You can access and configure these settings by clicking the “settings gear icon“.
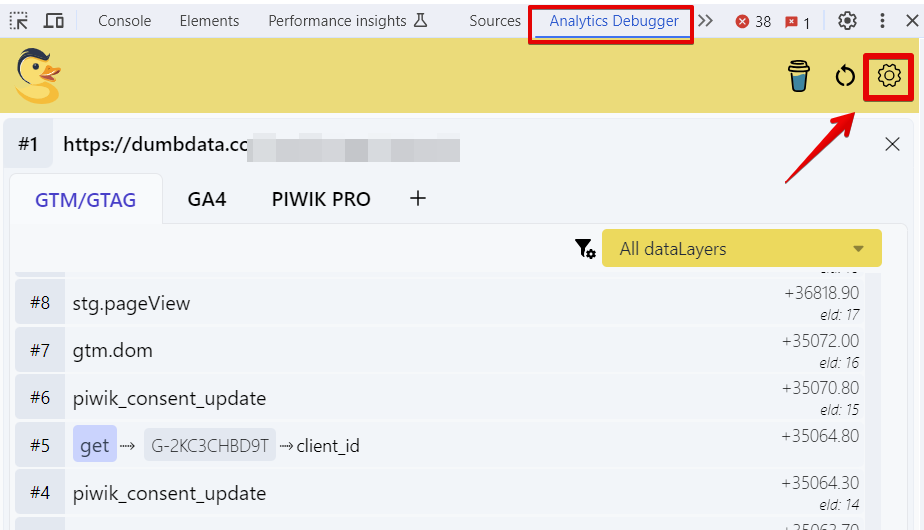
And then navigate to the settings section to find the available option within this tool.
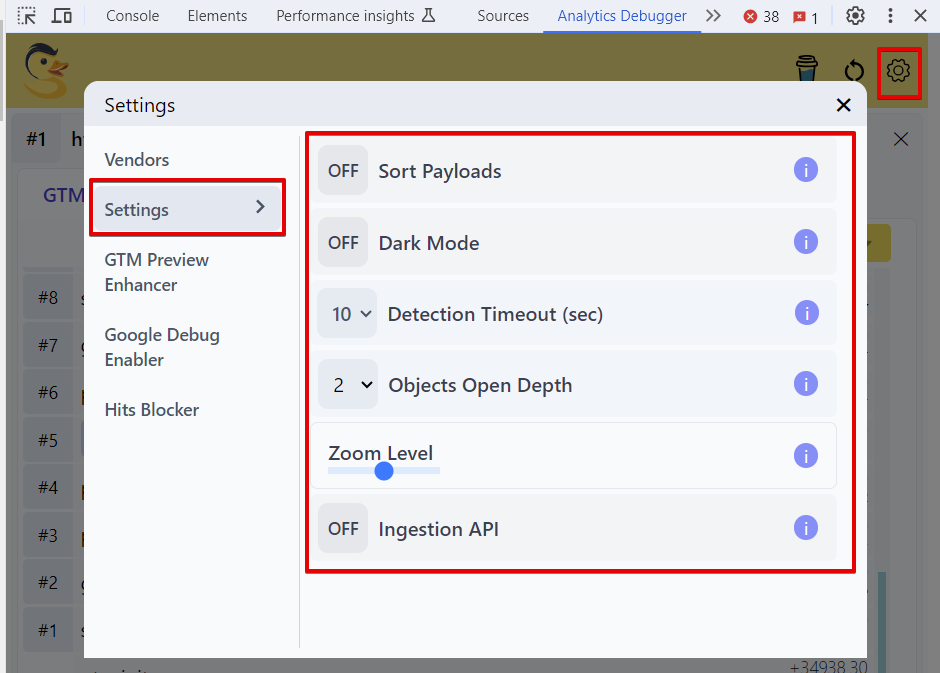
- Enable Dark Mode: You have the option to switch to dark mode, depending on your debugging interface preference.
- Payload Sorting: Customise the way payloads are sorted for better organisation.
- Time Delay for Analytics Tool Detection: Adjust the number of seconds that the “Analytics Debugger” waits to check if analytics tools like Piwik Pro are implemented on the website. The default is set to “10 seconds.”
- Object Depth: Set the level at which objects are expanded. The default is set to two levels.
- Zoom Control: Modify the zoom level for better visibility and representation of requests and data within the Analytics Debugger tool.
I’ve listed the settings above, which I feel might help improve your debugging experience for scenarios where you’re working with Piwik Pro.
Piwik Pro Tracker Debugger:
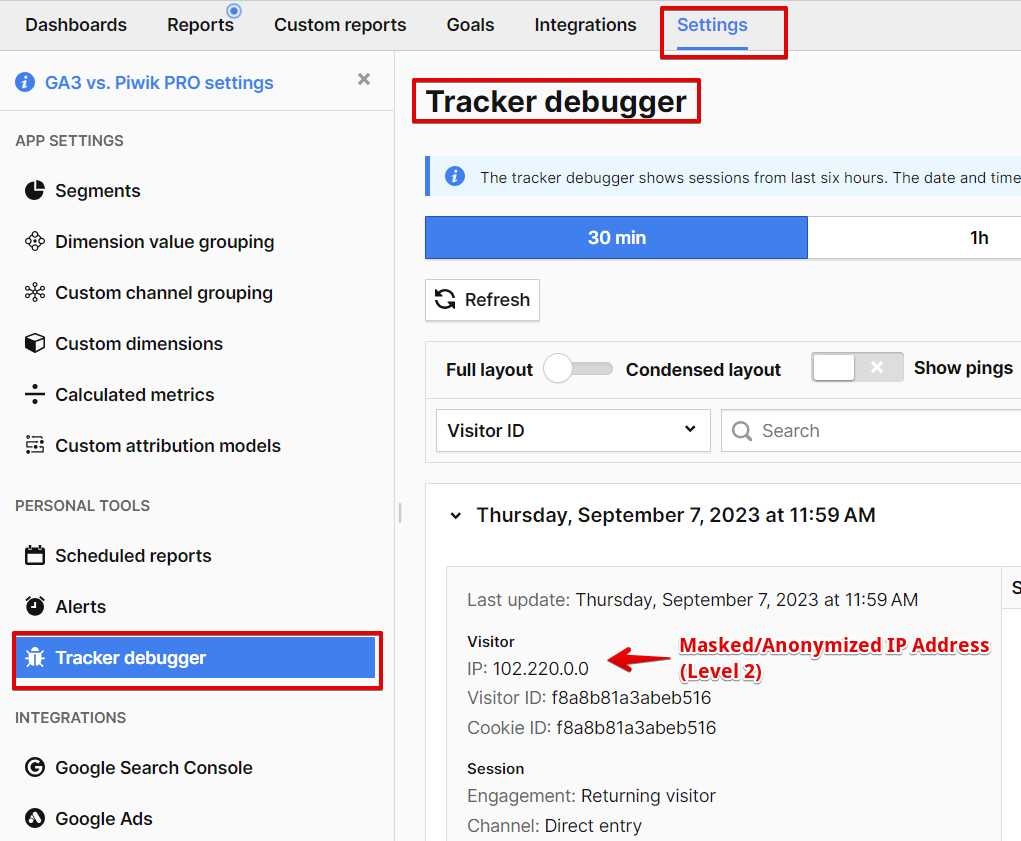
The Tracker Debugger is a valuable tool residing within the Piwik Pro Analytics suite. It serves the purpose of understanding how data is collected from your business website to your Piwik Pro property, both in real-time as they occur in users’ browsers and for a certain duration after data collection.
This tool offers insights into visitor sessions and events recorded within the past six hours. Additionally, you can narrow down your focus to review data collected in the last ‘30 minutes,’ ‘1 hour,’ and ‘3 hours.’ This feature is particularly useful when you need to see the reflection of the changes that you’ve made to the tracking instrumentation you’ve added and need to ensure the accurate collection of data.
To access this tool, first, ensure that you’re within the Piwik Pro Analytics suite.
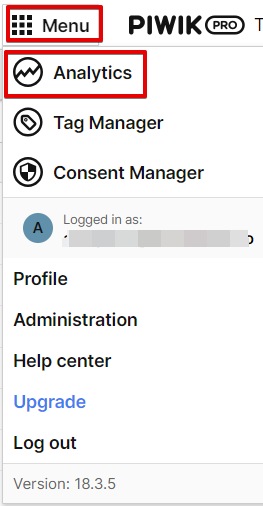
Then, navigate to the “Settings” tab, and within the “PERSONAL TOOLS” section on the left, you’ll find the “Tracker Debugger.” Click on it to access the tool.
Please note: The Tracker Debugger exclusively displays sessions from the most recent six hours; data exceeding this timeframe will not be displayed in the reporting interface of this tool. The tool calculates time using the site’s or app’s configured time zone in your Piwik Pro settings.
Before I delve into the additional settings available in this tool, let me introduce a handy trick to enhance your productivity when debugging your Piwik Pro setup using the tracker debugger. You can apply a filter to display your own sessions exclusively. To achieve this, you’ll need your Piwik Pro visitor ID, which either of the following methods below can obtain:
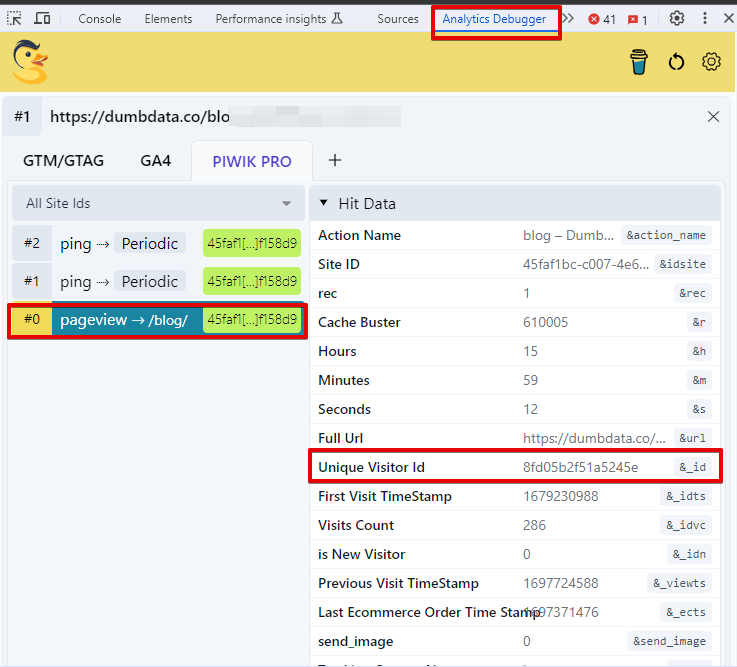
- Using the Analytics Debugger:
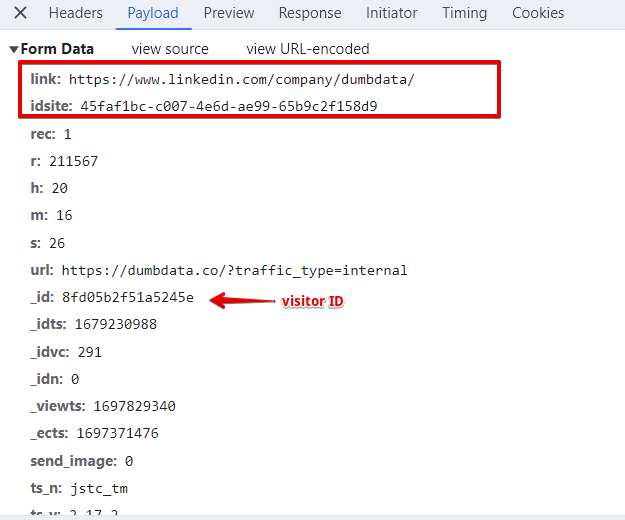
Within the “Piwik Pro” debug view inside the “Analytics Debugger” Chrome extension, navigate to the “Hit Data” section, where you’ll find the “Unique Visitor ID” row. Copy the value in the “visitor ID” field.
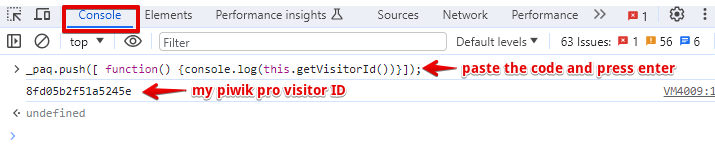
- Executing It Through the Console:
While on your website, open the console tab. For Windows, use “Control + Shift + J,” and for Mac, use “Command + Shift + J.” Then, run the JavaScript code provided below by copying and pasting it into your browser console and pressing the “Enter” key.
_paq.push([ function() {console.log(this.getVisitorId())}]);
This action will return your unique Piwik Pro visitor ID. I’ll delve into the usage of this browser console and scenarios where it can be applied shortly.
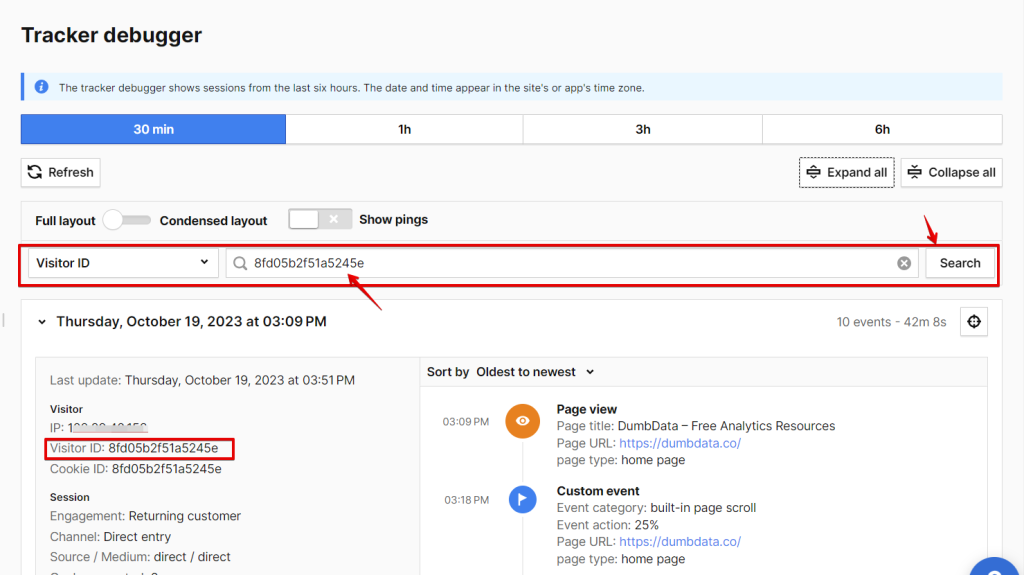
Once you’re in the Tracker Debugger interface, to filter the displayed sessions in this tool to show only your own session, you might still be viewing all your website visitors.
After you’ve copied the visitor ID, paste it into the “Visitor ID” filter field and click the search button or press “Enter.” You should now see only your sessions.
Expanding the tab further reveals that I have applied a filter to display only my own website visits. As you can observe, the Piwik Pro visitor ID remains the same, allowing me to verify if my implementations are functioning as intended.
Other valuable features that exist within the Piwik Pro Debugger tool, designed to make debugging more engaging and efficient, include the following:
1. Filtering By Hour: At the top of this tool, clickable buttons allow you to sort data collections by the time they are collected and recorded in Piwik Pro analytics. You have the option to filter for “30 minutes,” “1 Hour,” “3 Hours,” and “6 Hours” of website traffic.
2. Refreshing Live Data Collected in Piwik Pro Analytics: If you can’t locate the newly performed website interactions that you’re tracking as a Piwik Pro event or Piwik Pro goal, you can click the “Refresh” button to display recently collected website traffic action data.
3. Sorting Piwik Pro Hit Reporting: You can arrange in the order of how hits are displayed in the Debugger tool. The options available include sorting by “oldest to newest” and vice versa. This sorting is done at the session level. Once you’ve identified your session, you can utilise the “sort by” dropdown to select your preferred sorting settings.
4. Session and User Traffic Details: One notable aspect of this tool is that you can access visitor and session information for the website visitors on the left-hand side of the session you’re viewing. Additionally, you can review date-related details about the visit, any custom dimensions applied to their visit, and the technology they use to browse your website.
Innovatively, you can use this part of the Piwik Pro Tracker Debugger to:
- Verify if custom dimension implementation is functioning correctly.
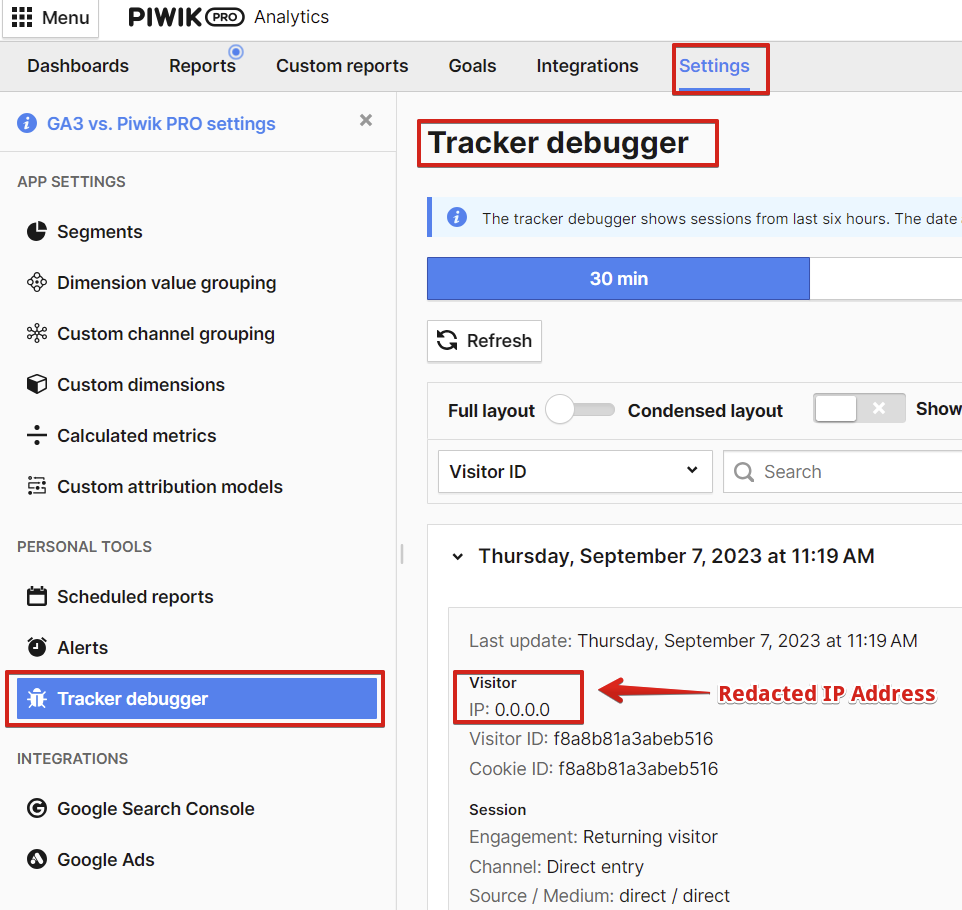
- Check whether your Piwik Pro IP anonymisation or redaction configuration aligns with the intended settings, which is essential for debugging privacy-related setups.
- Identify any issues in your Piwik Pro e-commerce tracking instrumentation (This guide will help you identify and fix e-commerce tracking issues in Piwik Pro Analytics.
Here is an example illustrating the configuration of “Level 2” IP masking or anonymization in Piwik Pro and how you can use the “Tracker Debugger” tool to verify your setup.
Here is another screenshot from the “How To Redact PII In Piwik Pro” article, demonstrating how IP redaction in Piwik Pro is functioning with the assistance of the “Tracker Debugger” tool.
5. Other Filter Capabilities: Besides filtering by visitor ID to isolate your sessions, you can apply filters based on the following data points. It’s important to note that these filters are predominantly session-level filters:
- User ID: This filter corresponds to the custom user ID you capture in Piwik Pro Analytics.
- IP: Allows you to filter traffic based on an IP address you provide in the filter field.
- Page URL: This filter allows you to input either a single URL string or the complete URL. This filter will then display sessions where the web page you specified was visited or when a web page containing the entered value was visited.
- Event Type: This is another session-based filter that provides you with the capability to select specific types of Piwik Pro events, such as page views, goal conversions, downloads, site searches, and more. The options available are diverse.
6. Layout Customisation: The Piwik Pro Tracker Debugger tool offers settings that allow you to personalise how your website visitor’s near real-time reporting of session data gets displayed in the tracker debugger. These options include:
- Choosing between a “Full Layout” and a “Condensed Layout” alters the presentation style.
- The flexibility to expand or collapse the displayed session data in the tracker debugger.
- An option to hide or show Piwik Pro pings and pings helps monitor the visitor’s session activity to accurately calculate session time in Piwik Pro.
With the Piwik Pro Tracker Debugger tool thoroughly covered, let’s proceed to explore the third option on our list.
Piwik Pro Debug Mode
Think of this as your Tag Management Debug Mode, similar to what you find in Google Tag Manager. Piwik Pro Debug Mode becomes particularly valuable when you’re using the Piwik Pro Tag Manager in your data collection strategy for event instrumentation and website tracking.
This debugging feature serves the crucial role of assessing the correctness of your instrumentation within Piwik Pro Tag Manager before you push the tracking instrumentation live for all website visitors. The Debug Mode allows you to load your website with unpublished changes in your Piwik Pro Tag Manager, enabling you to thoroughly test how tags, triggers, and variables behave as you interact with the website.
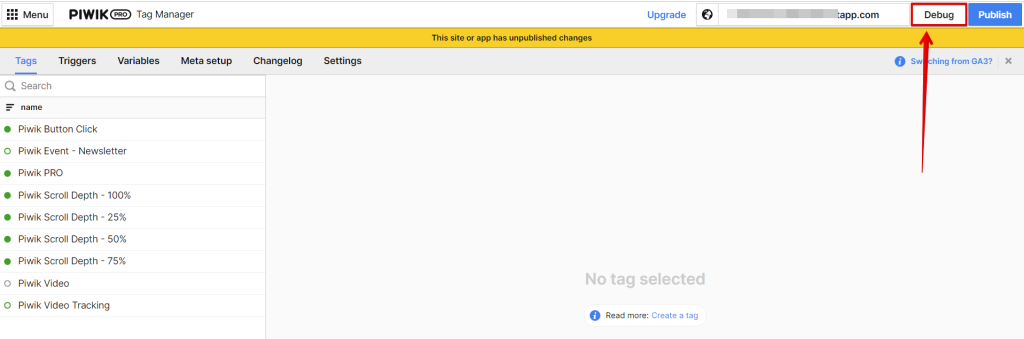
One way to access and use the “Debug Mode” is through the Piwik Pro tag manager.
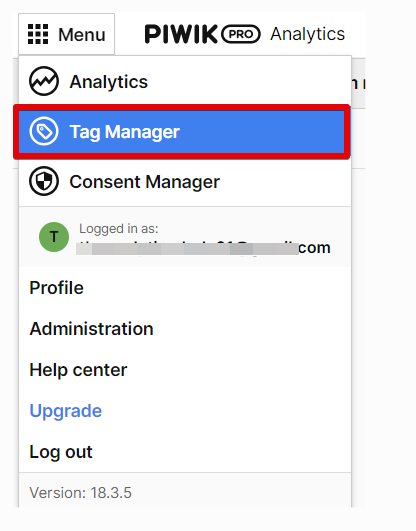
To access and use this debugging option, you can navigate to Piwik Pro Tag Manager and initiate the process by clicking the “Debug” button.
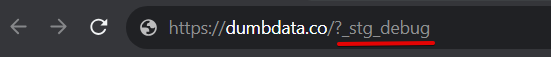
Alternatively, to activate the Debug Mode, you can append “?_stg_debug” to the end of your website’s URL and then refresh the page to activate and use the Piwik Pro Debug Mode.
Still Can’t See the Piwik Pro Debug Panel?
If neither of the options listed above enables the debug view and displays the debug mode for you, then the two workarounds below should be very helpful.
Step 1: Setting The Debug Cookie
This workaround involves manually setting the “stg_debug” Piwik Pro first-party cookie, which helps display your site in debug mode when you use Tag Manager. The cookie is removed after you close the debug mode.
The cookie value is “1” and the expiration period is 14 days, and since the debug mode isn’t displaying for you, this can likely be attributed to the fact that the cookie isn’t available.
So what do you do?
Use the code below and execute it on your browser developer console by opening the browser console.
function setCookie(name, value, daysToExpire) {
    const date = new Date();
    date.setTime(date.getTime() + (daysToExpire * 24 * 60 * 60 * 1000));
    const expires = "expires=" + date.toUTCString();
    document.cookie = name + "=" + value + ";" + expires + ";path=/";
}

setCookie("stg_debug", "1", 14);
After executing the code, reload the website, and you should see the Piwik Pro debug panel.
If it still doesn’t show up for you, then you have one more step, which is the second step. If it does show up for you, you can start performing your test and ignore the second step below.
Step 2: Manually Making The Debug Panel Visible
For this step to work, you need to have completed step one and still not seen the Piwik Pro debug panel.
In this step, you will use JavaScript code to execute on your browser developer console.
The code will check for the presence of the Piwik Pro debug panel element with the query selector “#seventag_container_debugger” and make it visible by setting its CSS z-index property to a high value to ensure it is on top.
Below is the code you’ll execute in your browser console. Everything should be fine, and you can start debugging again.
(function() {
  const element = document.querySelector("#seventag_container_debugger");
  if (element) {
    element.style.display = 'block'; // Ensuring the element is visible
    element.style.zIndex = 2147483647; // High value to bring it to the front
    console.log("Element is now visible and on top.");
  } else {
    console.log("Element not found.");
  }
})();
In a situation where all the solutions I have shared above still don’t work, then it’s likely reasons behind this issue could be one of the following:
- Your browser or ad blocker is likely obstructing the Piwik Pro tracking code (and Debug Mode).
- Your website Content Security Policy (CSP) hasn’t been adjusted to allow Piwik Pro requests to be dispatched from your website.
Given that it works for me in my scenario, allow me to guide you through some of the features and settings of this tool and how to utilise them for effective debugging.
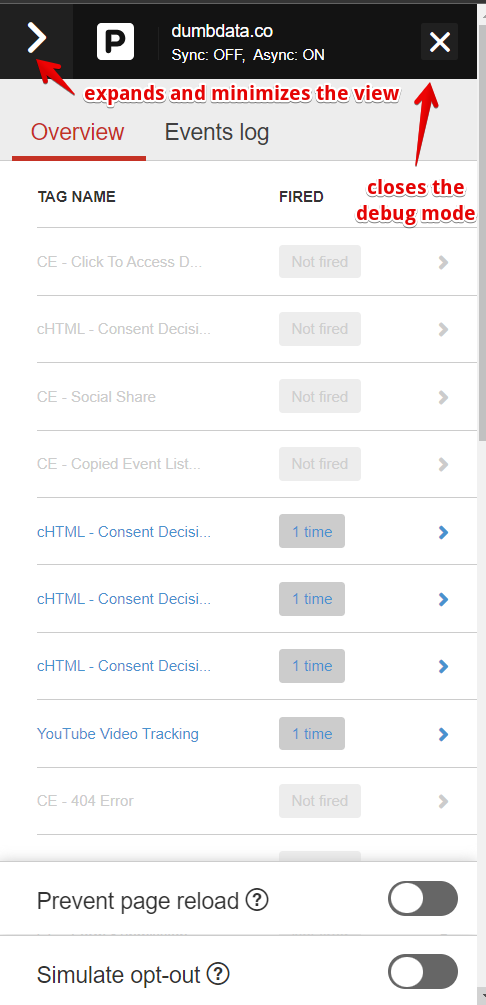
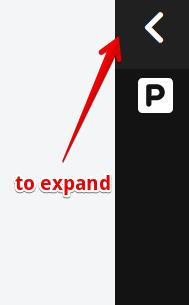
1. Minimization & Exiting The Debug Panel:
Clicking the “right arrow” icon minimises the debug panel, and by clicking the arrow in the opposite direction when it’s in its minimised state, you can expand the debug mode panel. If you wish to close the debug mode tool completely, you can do so by clicking the “x” icon, which will reload your web page and close the debug mode panel. Alternatively, you can take the longer route of adding “?_stg_disable_debug” to the URL to achieve the same result, although I wouldn’t recommend it.
Clicking the arrow also maximizes the debug mode panel.
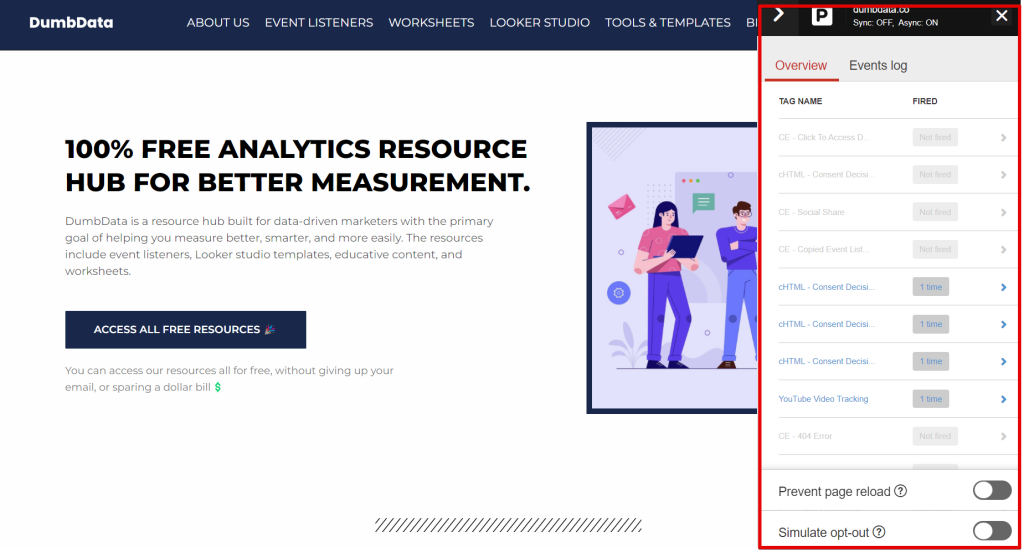
2. Control Page & Consent Behavior:
Enabling “Prevent Page Reload” effectively freezes the page, preventing it from reloading when you interact with elements such as buttons, forms, or menu items. This option is particularly useful for inspecting form submissions and tracking user interactions that initiate a page reload or links to external or internal pages on the website.
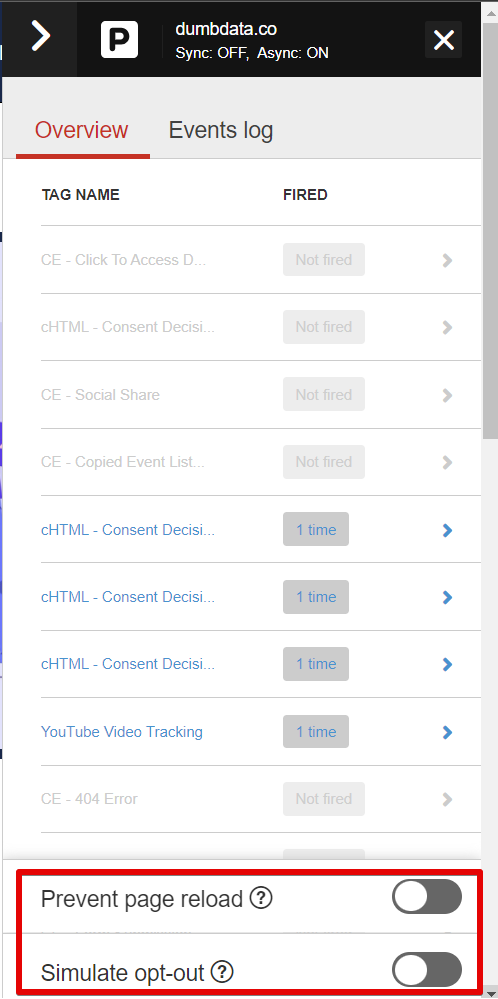
To simulate your browser as if a user has opted out of tracking, you can toggle the “Simulate Opt-out” option. This comes in handy when debugging compliance-related instrumentations.
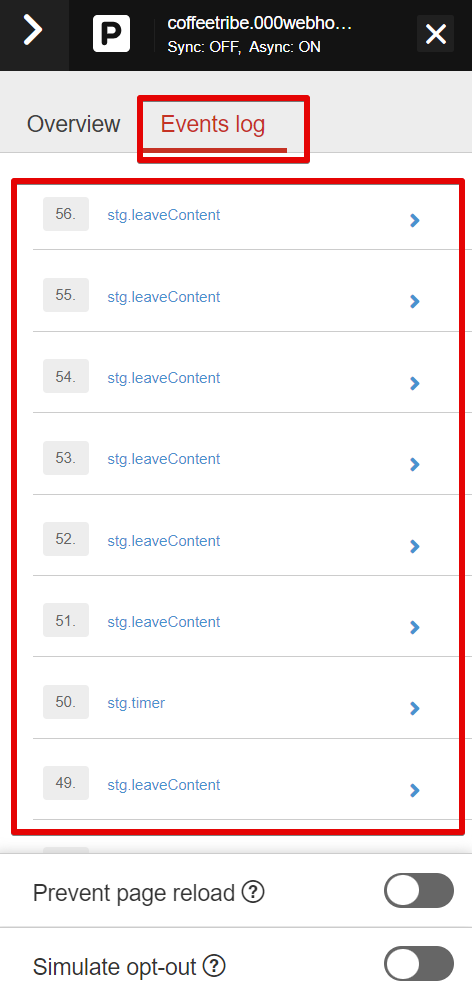
3. Overview & Events Log:
The debug panel in the Piwik Pro Debug Mode is divided into two tabs: “Overview” and “Event Log.”
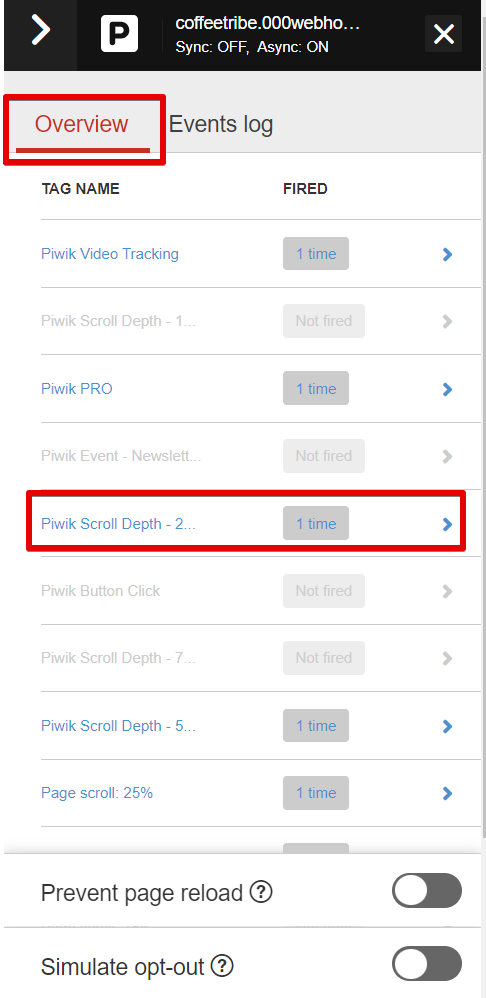
3a. The Overview Tab:
This tab offers a straightforward display of the “active” tags that are in your Piwik Pro Tag Manager. It doesn’t show inactive (paused) tags.
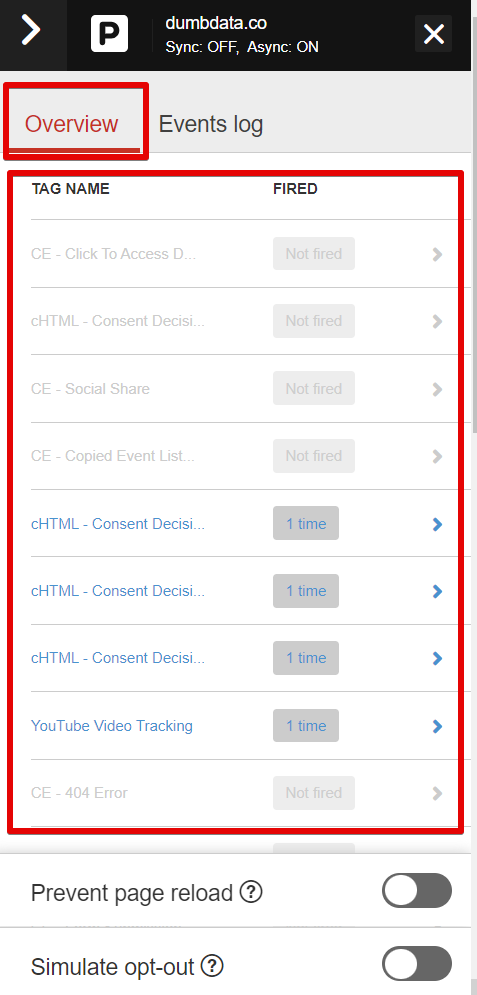
It indicates whether they have been fired or not, along with the count of times they’ve been triggered.
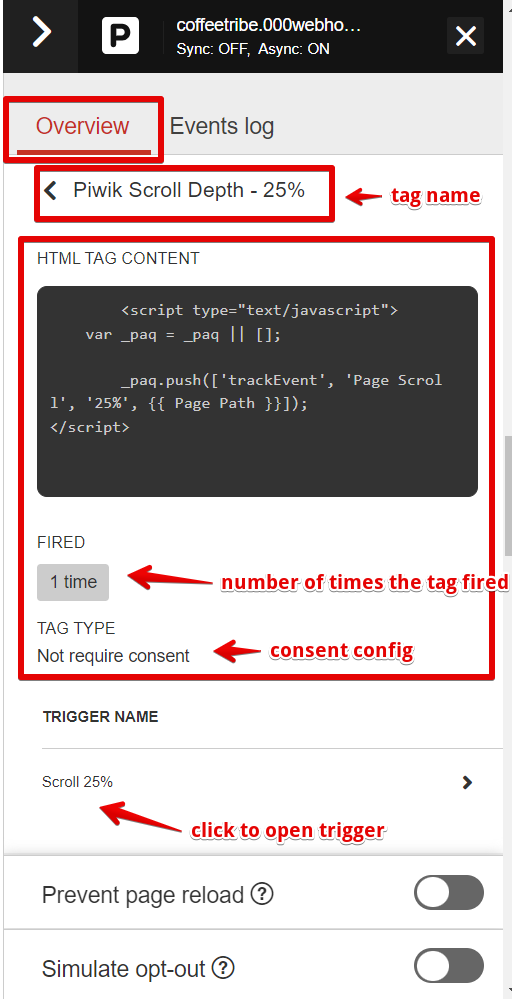
Clicking on a tag reveals additional information, such as the HTML tag content, the number of times it has been executed on the web page, the necessary user consent required before execution, and the name of the trigger responsible for the tag’s activation.
You can further inspect the trigger’s configuration within the Piwik Pro Tag Manager.
3b. The Event Log:
This view of the debug mode panel functions as a comprehensive report for all the dataLayer events executed on the current web page; the “Event Log” provides further insights.
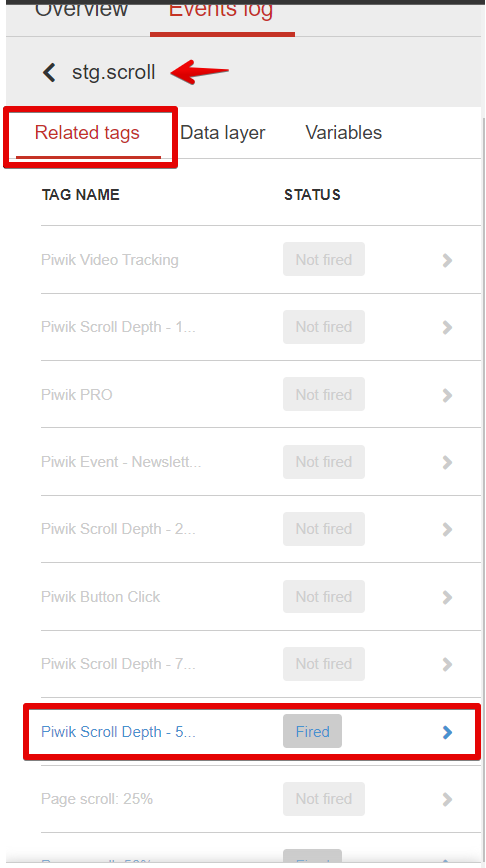
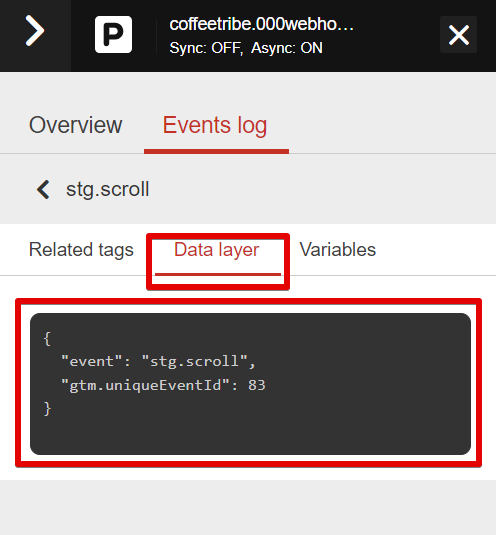
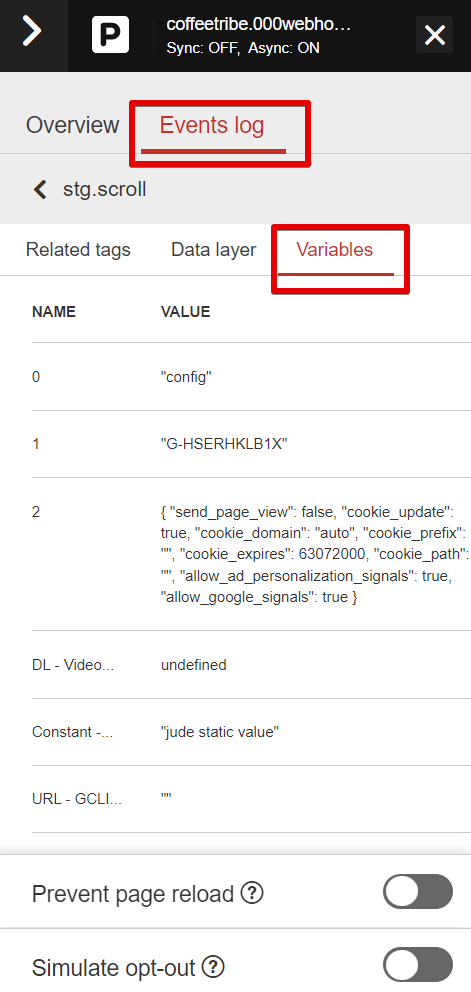
Clicking on an event opens up three additional tabs:
- Related Tags: This tab displays the tags that fired within your Piwik Pro Tag Manager when the dataLayer event was recorded. Clicking on a specific tag takes you to the same detailed view as in the “Overview Tab” of the Piwik Pro Debug Mode.
- DataLayer: Here, you can access the actual dataLayer event that was executed.
- Variables: This tab provides a comprehensive list of all variables present within the Tag Manager. Furthermore, it displays the respective values of these variables at the moment of the dataLayer event. This functionality serves to help you ascertain whether the variable values align with the expected values at the time of tag execution.
The Piwik Pro Debug Mode stands as a valuable tool in your toolkit, offering extensive capabilities for thoroughly testing your instrumentation before you commit to publishing it within the Tag Manager.
Some Areas of Improvement;
However, it has certain limitations worth noting. First, it needs a search bar for quickly locating a specific tag; this can be helpful in scenarios where you have plenty of tracking tags in your tag manager. It will be excellent also to get the ability to sort the tags.
Additionally, it doesn’t retain a history of prior web page interactions, potentially making it challenging to backtrack.
Thirdly, the debug mode interface is fixed and not expandable beyond its current display, limiting flexibility. While the ability to find variable values is valuable, the process may not be the most user-friendly. Nevertheless, the debug mode is a cool tool, and I hope to see the innovative Piwik Pro team improve this debugging tool.
You can also use this tool for prospecting or spying to see what the client has in their Piwik Pro tag Manager, especially when you don’t have access to their Tag Manager.
WASP.Inspector Chrome Extension
WASP.Inspector Chrome Extension is a visual debugging tool that provides an insightful representation of data collection requests initiated by MarTech vendors in a user’s browser. It offers in-depth information regarding payload requests.
To find and enable this Chrome extension, you can simply click on the provided link, which directs you to the Chrome Web Store’s extension page. From there, you can seamlessly add the extension to your Chrome browser.
The name of this Chrome extension, “WASP,” stands for “Web Analytics Solution Profiler.” It is owned by Cardinal Path, much like David Vallejo’s “Analytics Debugger” Chrome extension, WASP.Inspector, once installed, introduces a new tab within the Chrome developer tools. This tab visually facilitates the quick identification and comprehensive examination of analytics tags and various technologies as you navigate the web.
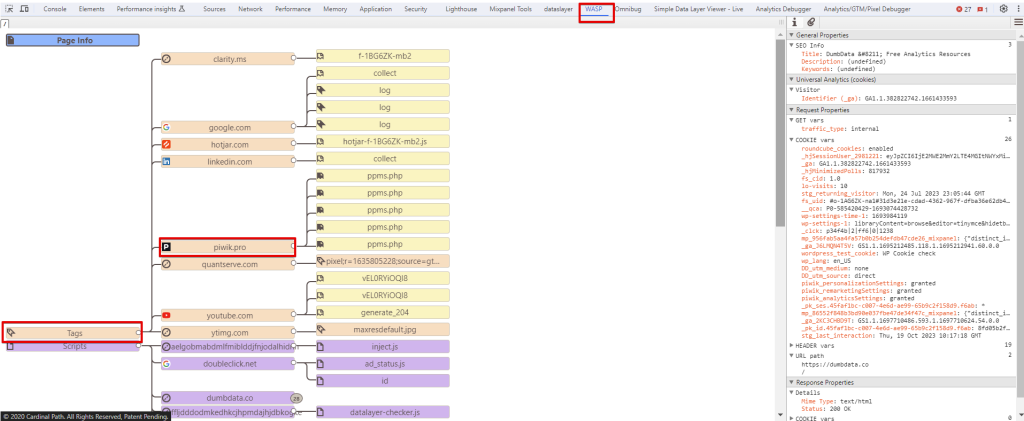
In terms of using this extension for debugging Piwik Pro implementations, I personally haven’t encountered a situation where I needed to utilise it. However, that doesn’t diminish its potential usefulness. This extension can still be utilised to inspect Piwik Pro requests, especially if you’re not entirely familiar with or comfortable using the “Network Debugger” within the browser developer tools. Let’s delve into how you can use this extension for debugging your Piwik Pro tracking setups:
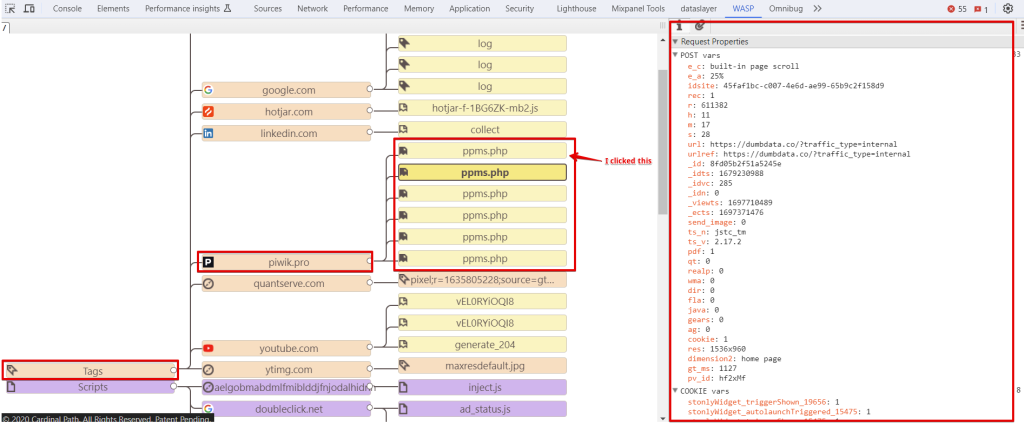
Within the debug interface, you have the flexibility to expand or collapse any path flow by clicking on the dot at the end of it. Given that our focus is on Piwik Pro, ensure you’re navigating the “Tags” path flow. Locate the “Piwik.Pro” vendor, and by clicking on any of the requests, you get presented with detailed insight regarding the request payload and the response properties.
The only drawback to this tool is that you will need to manually inspect each request to determine the Piwik Pro event type. You will need more than simply looking at the path to provide information about whether it’s a page view, a search event, or a file download event hit request.
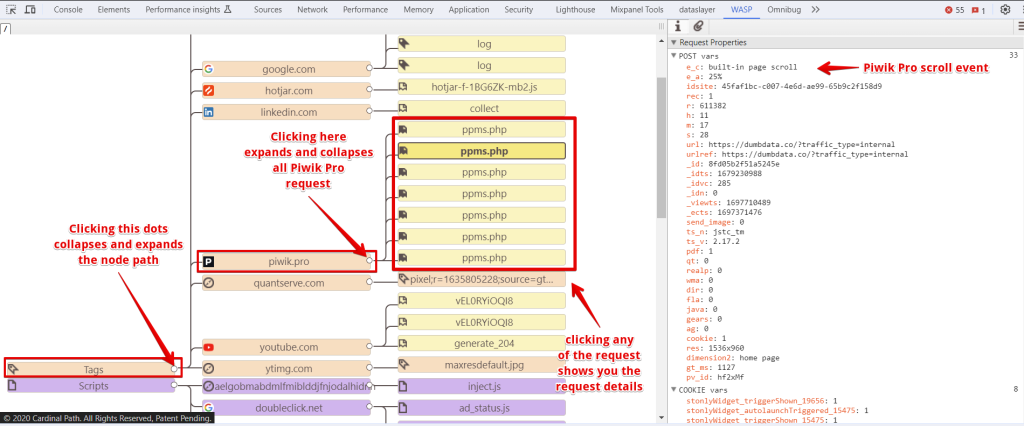
To ascertain the type of Piwik Pro request made, you should understand the structure of Piwik Pro requests and the significance of each request variable. This knowledge is crucial for identifying the Piwik Pro request type.
Browser Developer Tools (Network Debugger, Console, Element Inspector, and More):
If you’re not particularly tech-savvy or, like me, harbour an aversion to the term “developer,” fear not. Marketers and analysts can effectively harness these tools in our browsers, serving as valuable resources for identifying instrumentation-related issues. In the context of Piwik Pro, they also prove instrumental for debugging, and we will delve into their usage.
It’s worth noting that while my explanation of “Browser Developer Tools” primarily focuses on the Chrome browser, a similar approach can be applied in browsers such as Safari, Firefox, Microsoft Edge, and others with similar capabilities.
Essentially, these tools are at your disposal regardless of the browser you use.
Now, let’s explore the array of tools available for debugging for cases involving Piwik Pro Analytics:
- The Element Inspector
- The Network Debugger
- JavaScript Console
- The Application Storage
- The Sources Browser
These tools are versatile and accessible, ensuring you can leverage them effectively to diagnose and resolve issues in your implementation setup.
Element Inspector:
The Element Inspector allows you to explore the dynamic representation of the web page, also known as the Document Object Model (DOM). The term “dynamic” implies that it updates in real time as changes occur within the web page’s DOM structure.
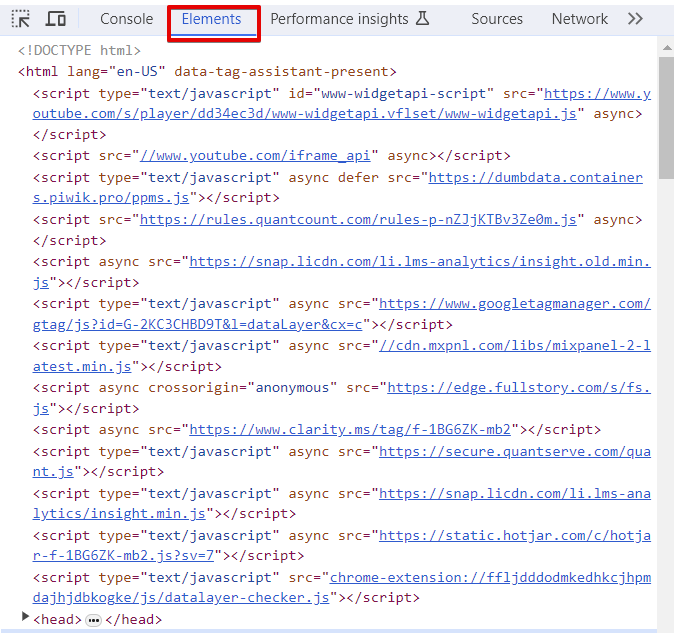
This developer tool is accessible through the “Elements” tab.
So, how can you utilise this feature for debugging in Piwik Pro? Here are a few ways:
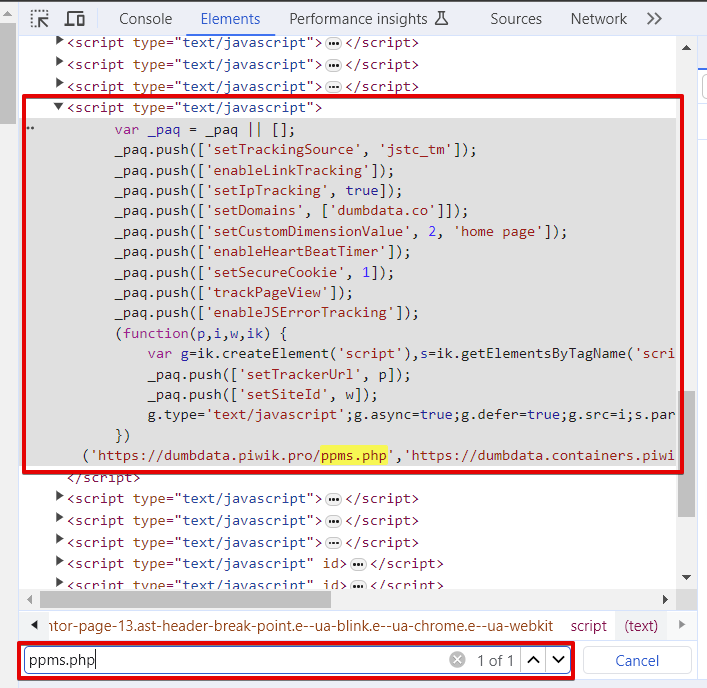
1. Detect If Piwik Pro Script Is Present on the Website;
To ascertain the presence of the Piwik Pro tracking script on a website, you can click on any part of the element code and then use the shortcut “CONTROL + F” to initiate a search for “ppms.php.” This search will promptly reveal the Piwik Pro script on your website. Additionally, you can use the Element Inspector to inspect the fundamental configuration of the Piwik Pro script currently running on the site.
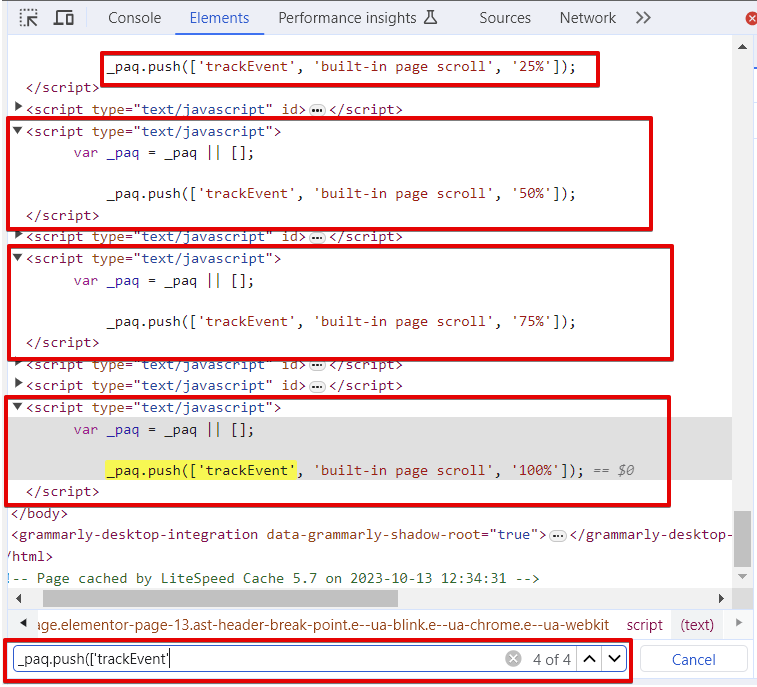
2. Check If a Custom Event Has Fired (Custom Dimension, Search, or Other Event):
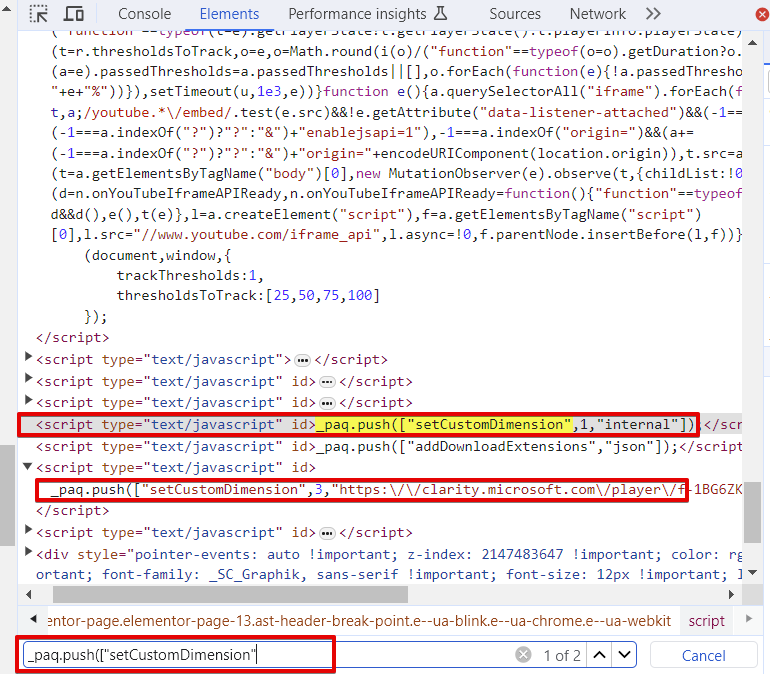
Given that the Element Inspector offers a dynamic view of the DOM, you can also use it to confirm whether Piwik Pro events, custom dimensions, or other events have been triggered on the website. You can accomplish this by executing the desired action and then utilising the element search feature to search for specific keywords. For instance, you can search for an event using “_paq.push([‘trackEvent’” and for custom dimension-related applications using “_paq.push([“setCustomDimension.”
The image is an illustration of the process for verifying the execution of Piwik Pro custom events tracking commands.
The image below demonstrates the validation of the Piwik Pro custom dimension application.
* Please remember that using it for this use case isn’t advisable.
Furthermore, the Element Inspector developer tool proves invaluable for debugging and gaining insights into how you’ve configured any element-related triggers or variables within Piwik Pro Tag Manager.
Browser JavaScript Console:
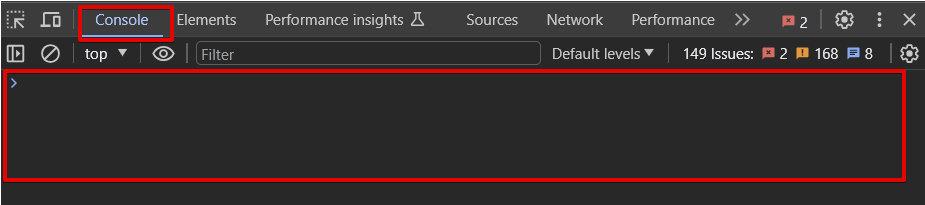
The Browser JavaScript Console serves as a code environment integrated within your browser. You can access this developer tool through the “Console” tab, and it provides a platform for running JavaScript code within the context of the current page or embedded frame. This tool is pivotal for identifying issues within the JavaScript implementations of your analytics scripts.
Clicking the “🚫” icon clears the message on your browser console.
So, how can you harness this tool for debugging in Piwik Pro? There are multiple applications for this tool, but here are some innovative ways to leverage the browser console during Piwik Pro debugging:
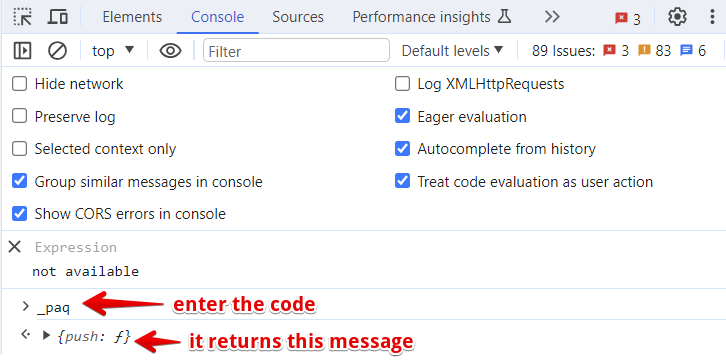
1. Detect the presence of Piwik Pro on the website: You can execute “_paq” to verify whether it returns “_paq.push,” indicating that Piwik Pro code has been executed on the web page.
2. Understand consent settings with custom cookie banners instrumentation: At DumbData, we used the browser console to test the consent integration we developed for the Piwik Pro Consent Manager. This served as one of our testing environments to verify if the Piwik Pro consent manager integration with custom cookie banners from providers like CookieFirst, Osano, and CookieYes worked.
For example, running the script below retrieves the current Piwik Pro consent settings.
ppms.cm.api('getComplianceSettings', function(settings){allConsents = settings.consents}); console.log(allConsents);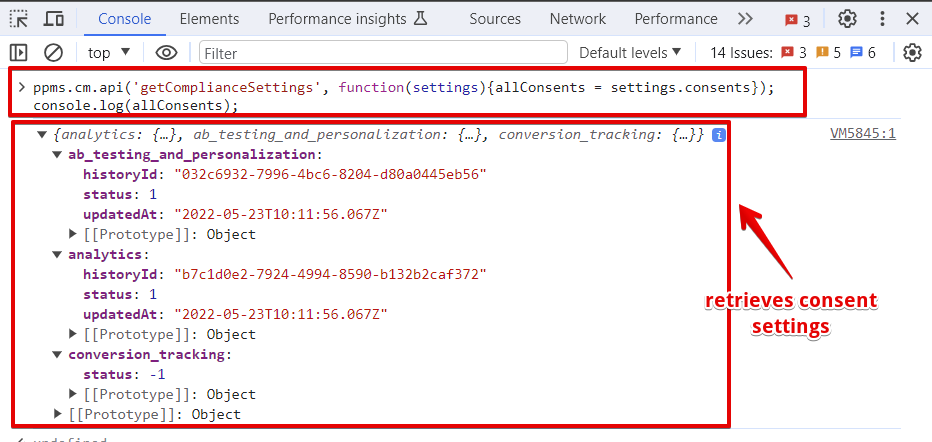
3. Simulate the execution of DataLayer for custom events: You can utilise the browser console to simulate the execution of the dataLayer that your Piwik Pro trigger relies on to initiate custom events. You can also use the browser console and Piwik Pro Javascript API tracking command to simulate page view events, e-commerce events, Piwik Pro custom dimensions, and other event action types.
4. Test programmatic customisations of your Piwik Pro configuration: The browser console proves invaluable for simulating event actions and assessing Piwik Pro configuration tag customisations. For instance, you can test the programmatic method of redacting IP addresses in Piwik Pro. After successful testing, you can seamlessly integrate the setup into your preferred Tag Manager.
5. Check for tracking instrumentation errors: The console can also be used to identify Piwik Pro tracking instrumentation errors or JavaScript-related errors. When such errors occur, Piwik Pro logs them to the console, allowing you to analyse and troubleshoot them. You can strategically use the browser console to send messages to understand better the code’s execution status in your Custom HTML tag within the Piwik Pro Tag Manager.
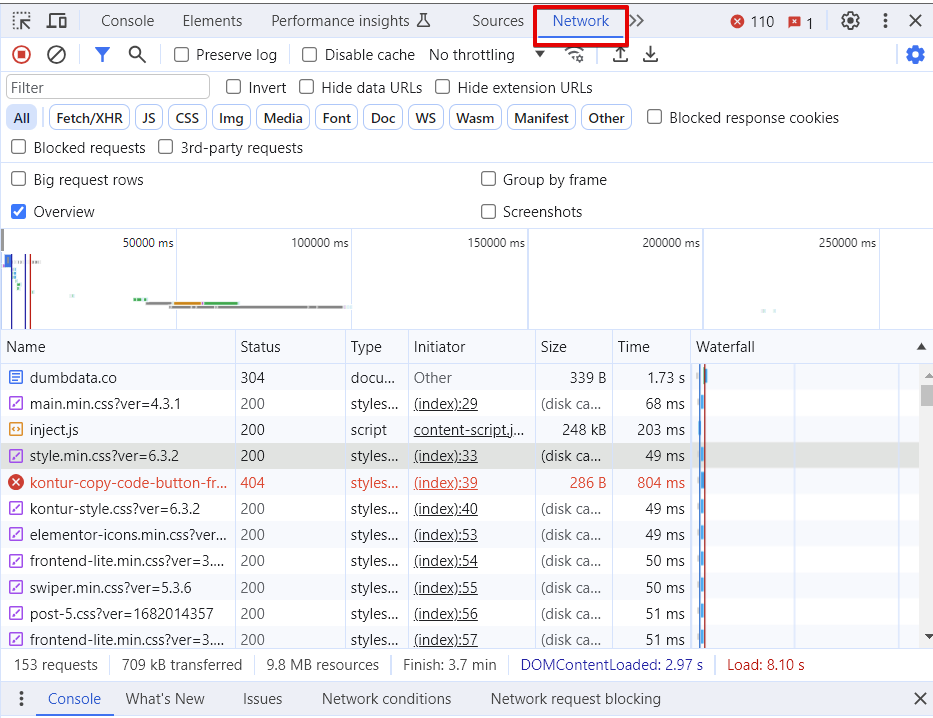
Network Debugger:
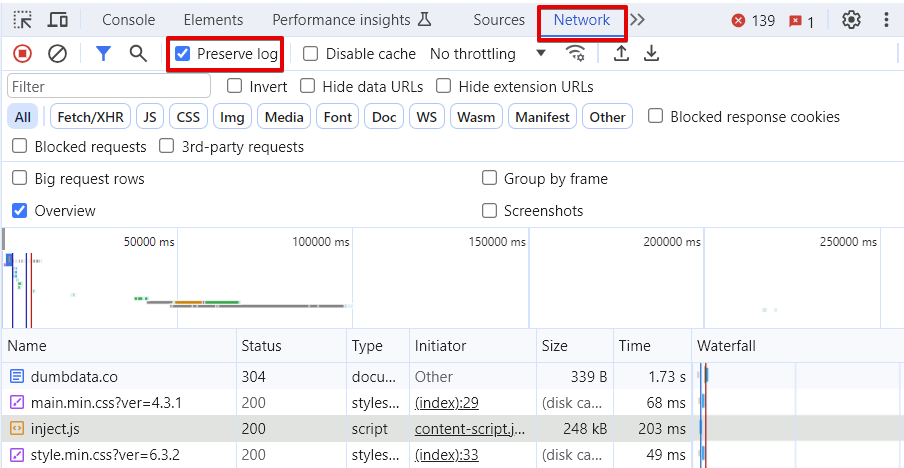
The Network Debugger is yet another valuable tool residing within your browser. It resides within its own tab aptly named “Network.” While it serves multiple debugging purposes, one of its primary applications is to determine whether your data was indeed collected and sent to the vendor endpoint. This is particularly crucial because web tag managers can verify if a tag has been fired, not necessarily if the data got transmitted to the vendor servers.
When using the “Network Debugger“, you might end up being in one of those scenarios where you’ll need access to the history of requests sent on the previous and subsequent pages or during page reloads, so it’s advisable to activate the “Preserve Log” option available within the tool so that you can still see the request of network request of the past pages.
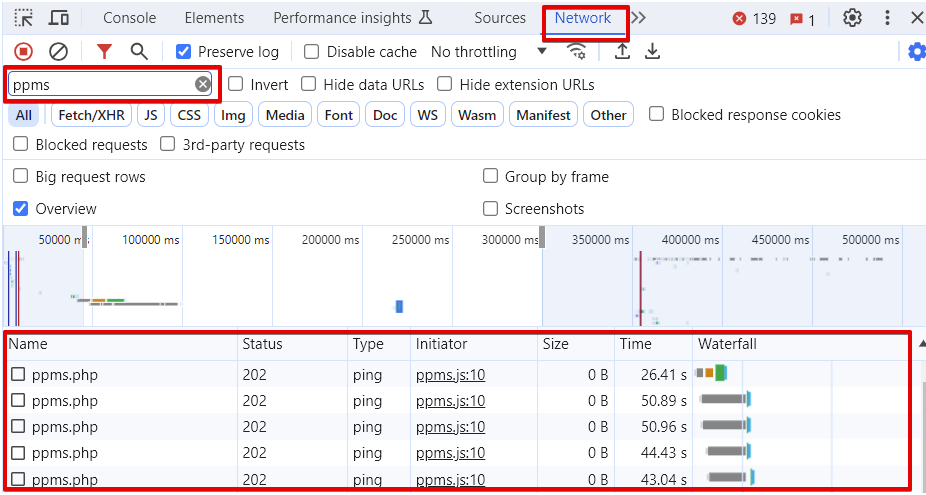
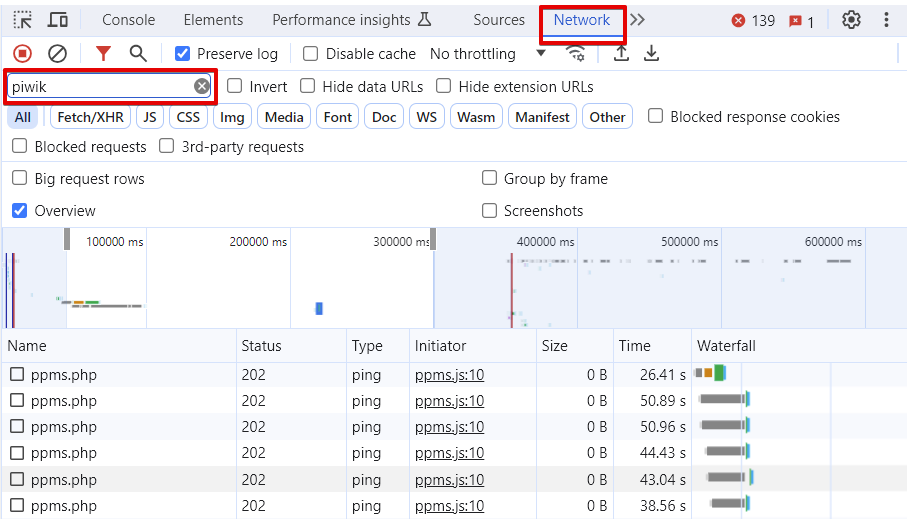
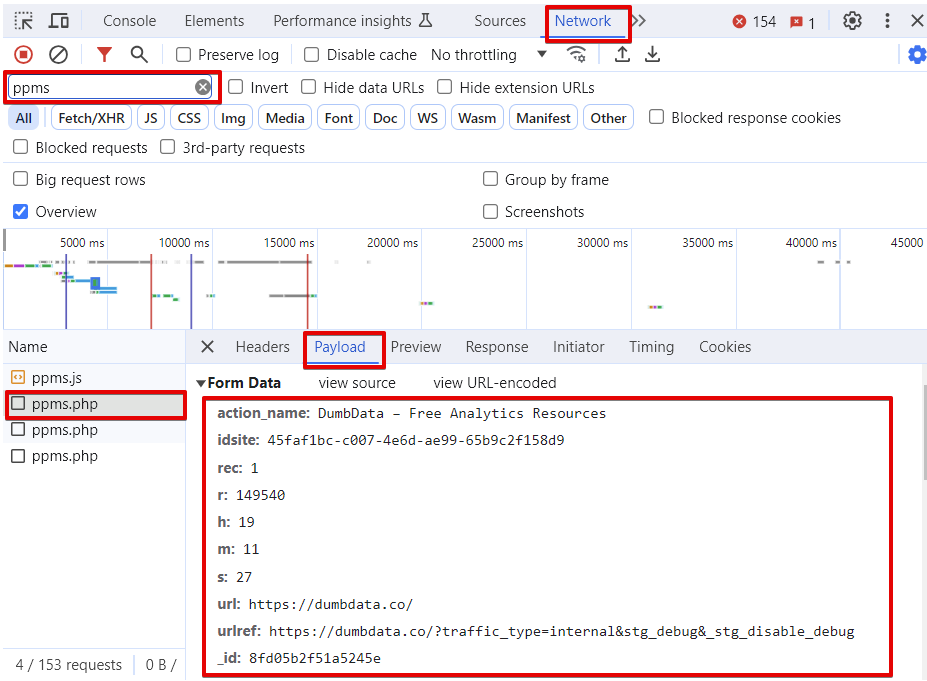
For efficient and effective debugging of Piwik Pro requests, you must make use of the filtering capabilities integrated into this tool. Simply enter a search term in the filter field. “ppms” or “piwik” (effective only when you’re not running Piwik Pro on your server instance) are two common search terms. However, “ppms” remains the preferred method in many cases.
Using the “ppms” search filter, which is the recommended approach.
Using the “piwik” search filter.
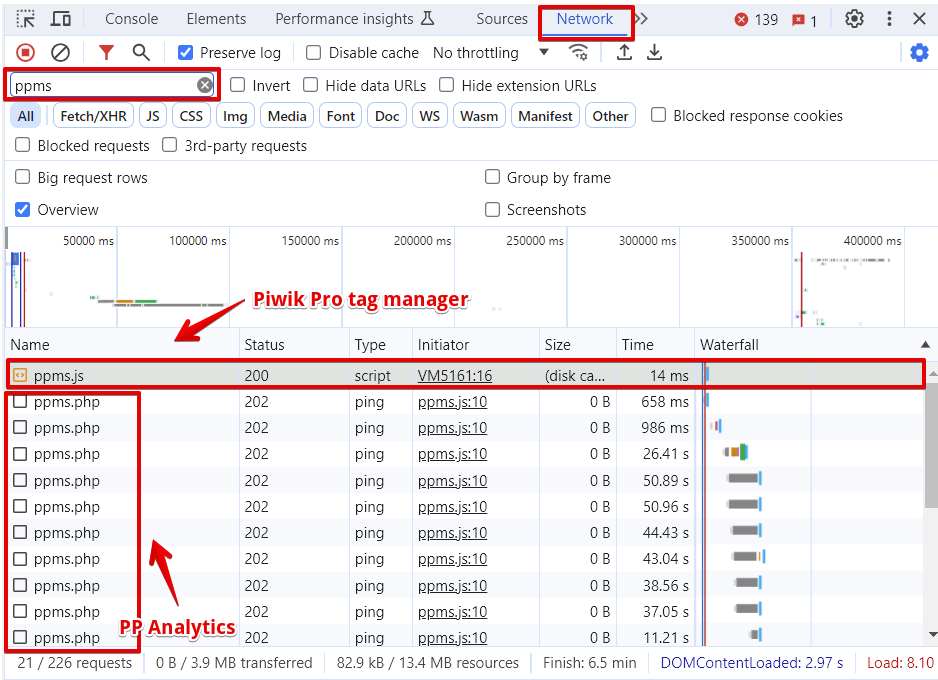
When you spot “ppms.js,” it represents the Piwik Pro Tag Manager, whereas “ppms.php” signifies Piwik Pro Analytics requests. After selecting any Piwik Pro request, navigate to the “Payload” tab, as this is the section you will use most frequently. It contains the query parameters and request body, which are immensely valuable when analysing what was transported to the analytics platform.
Clicking on a specific request in the Network Debugger reveals detailed information about the Piwik Pro request. The “Payload” section offers valuable and easy-to-understand insights about the hit.
For Piwik Pro Analytics requests, the payload may include various types:
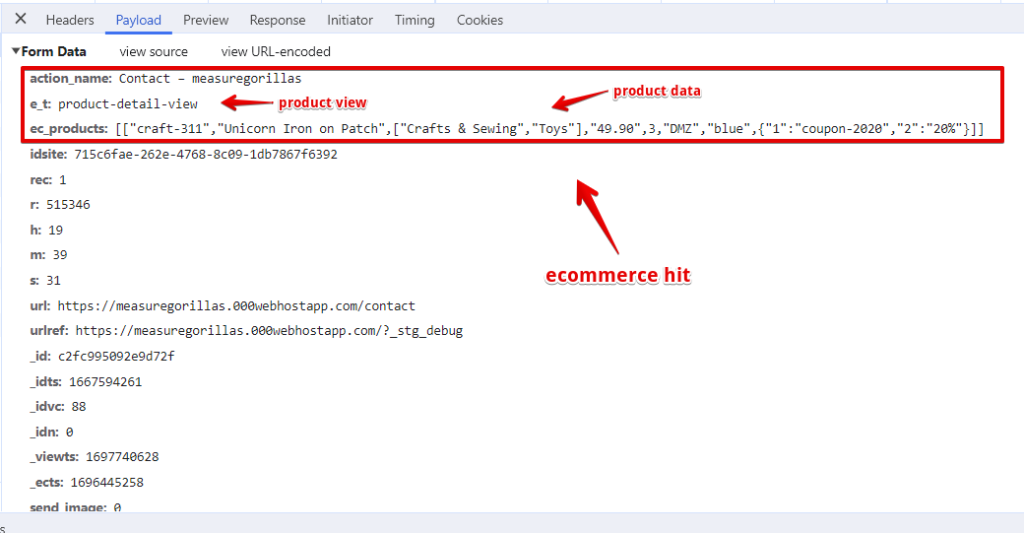
- ‘ppms.php?action-name=‘: Found on page load-related hits and pageview triggers, it’s also used for e-commerce actions. The “e_t” parameter specifies the e-commerce event type.
- ‘ppms.php?ping=‘: This request checks if the visitor’s session is still active.
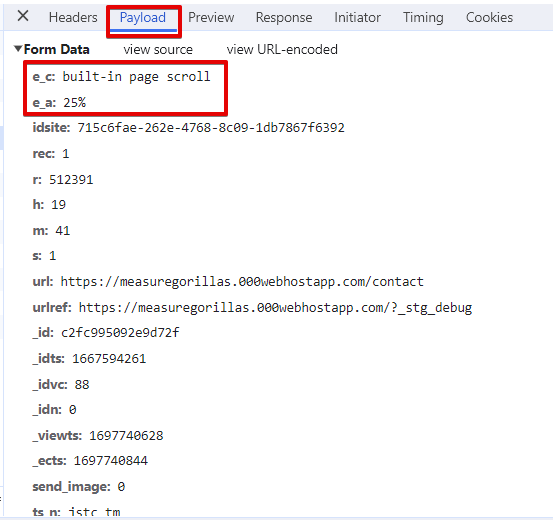
- ‘ppms.php?e_c=‘: Indicates a Piwik Pro custom event hit.
- ‘ppms.php?link=‘: Pertains to outbound link events.
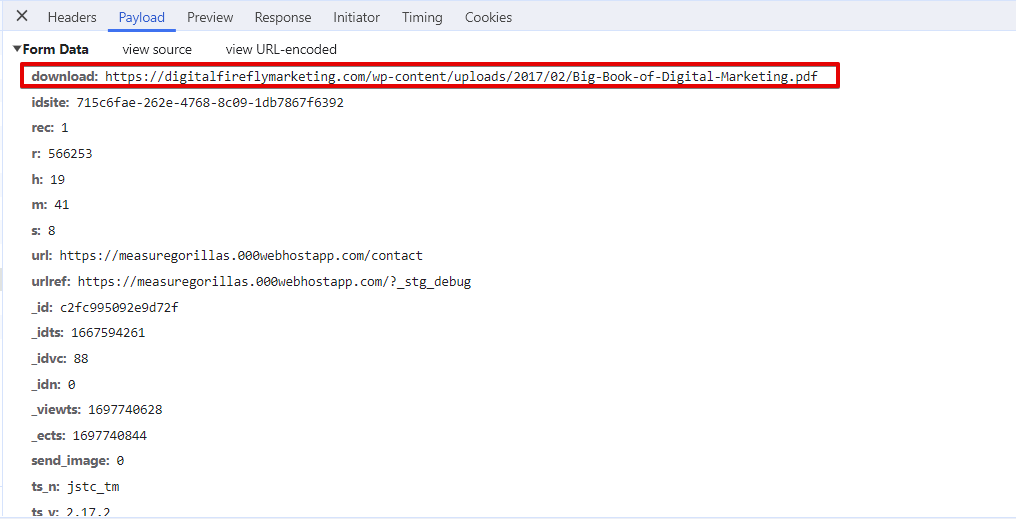
- ‘ppms.php?download=‘: Relates to file download events.
Example of a file download request.
Examples of custom event hits.
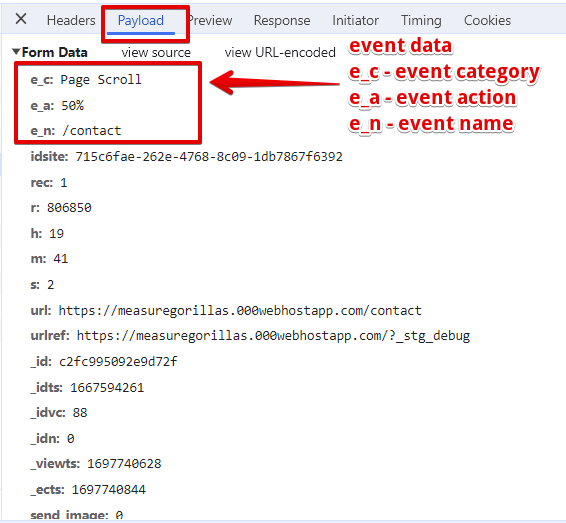
Another event request.
Example of transaction event type request.
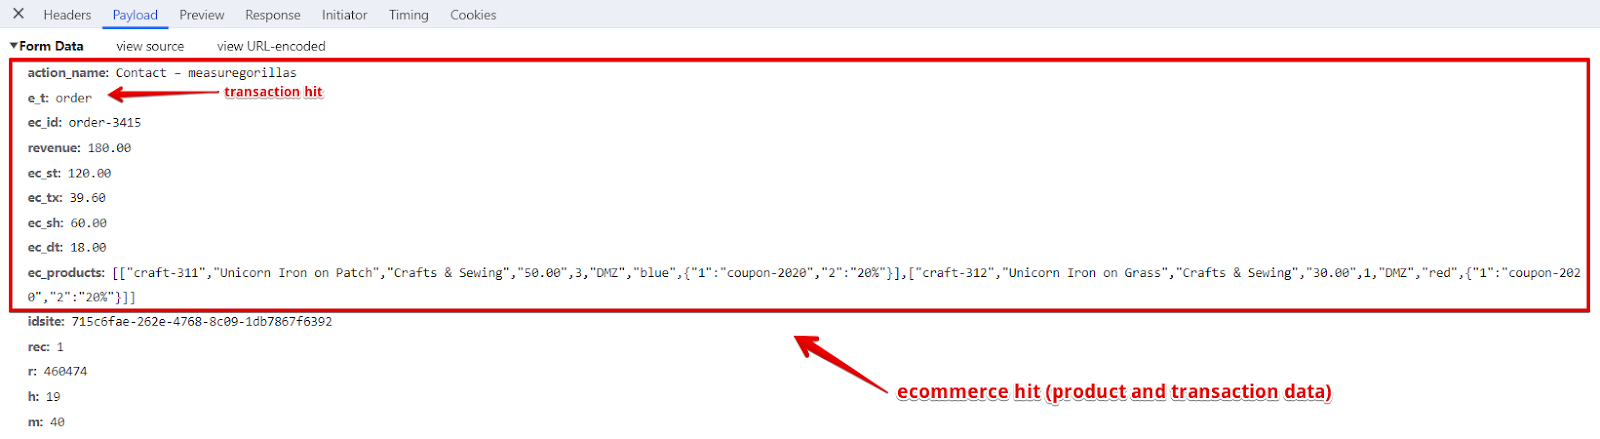
Examples of e-commerce request payload.
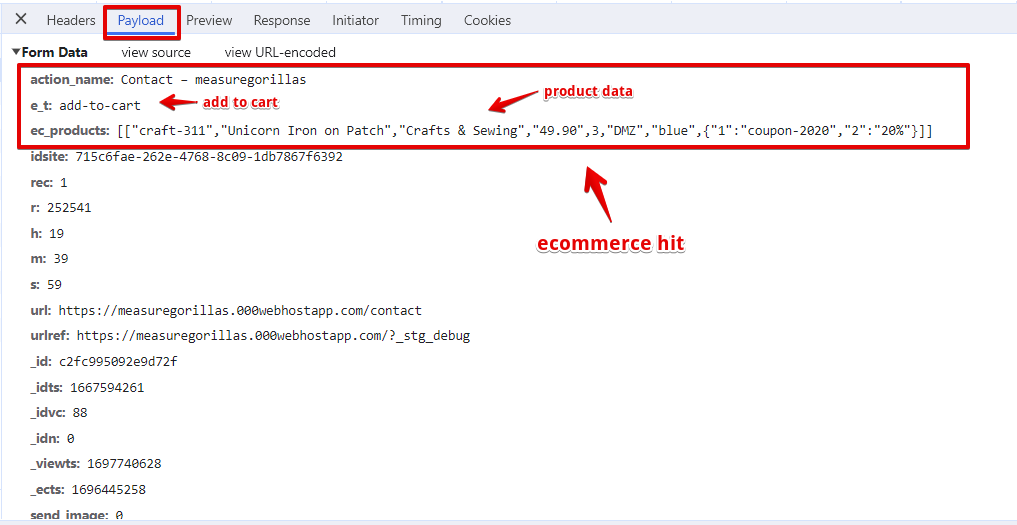
Add-to-cart request type.
Example of Outbound link request payload.
Application Storage:
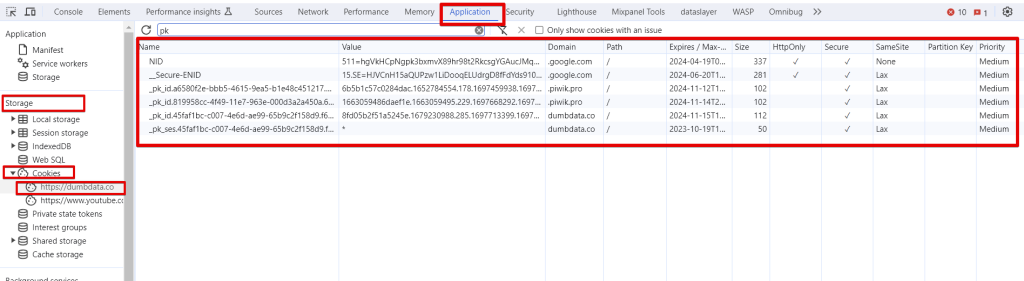
Like other developer tools, the Application Storage tool occupies its own tab labelled “Application.” This tool section provides information about browser storage, including cookies and local storage, used on the current page or within embedded frames.
Our focus is on the “Cookies” tab located within the “Storage” section of the “Application” developer tool. It allows you to investigate any abnormal behaviour in cookies set and used by Piwik Pro. This tool is instrumental in identifying and addressing issues in cookie behaviour. You can also use this tab to create, modify, and delete items in browser storage. It proves invaluable for comprehending the cookies generated by Piwik Pro to track website visitors.
You can access a comprehensive list of these cookies here.
Sources Browser:
This tool grants you access to the page source of the web page you’re currently viewing. It’s beneficial for understanding the hierarchical implementation of code by developers.
Locating the tool is remarkably simple. You can either right-click your mouse and choose “View Page Source” or utilize a Window keyboard shortcut by pressing “Control + U.”
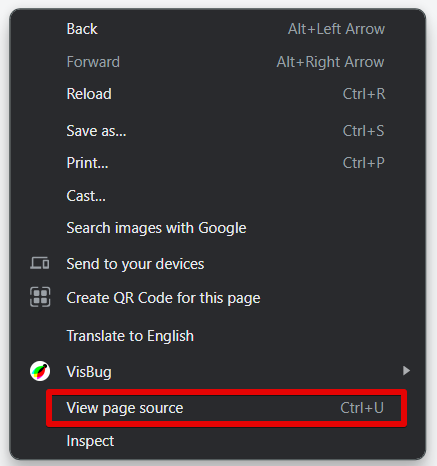
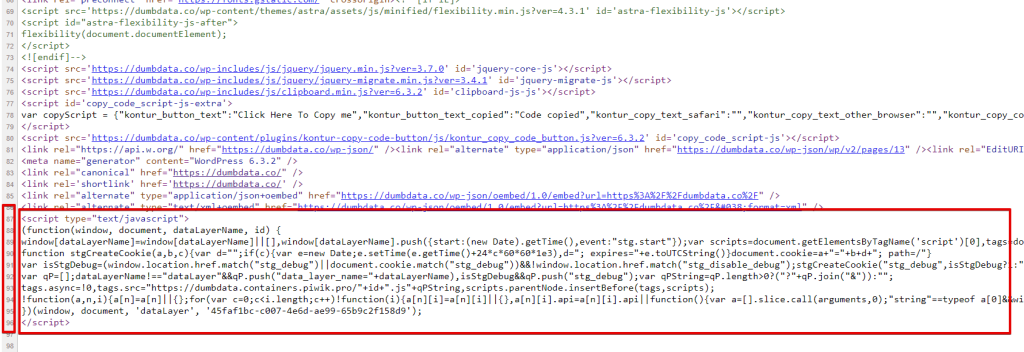
Utilizing the search feature, you can locate the implementation of the Piwik Pro tracking script and ensure its correct placement, especially in scenarios where a hierarchical structure is essential for accurate data collection within your analytics property.
We’ve explored several of the capabilities available within our browser, albeit just a fraction of them. Suppose you’re eager to delve deeper into these tools, not exclusively for Piwik Pro debugging but for debugging in analytics or tag management in general. In that case, you can refer to Simo’s comprehensive article for in-depth exploration.
The Other Buckets (Tag Explorer, Omnibug, Analytics Inspector, and Observe Point)
I refer to these as “the other buckets” because, in my experience, they primarily serve the purpose of verifying the installation of the Piwik Pro’s tracking script on a website, offering limited utility beyond that. Here are these extensions:
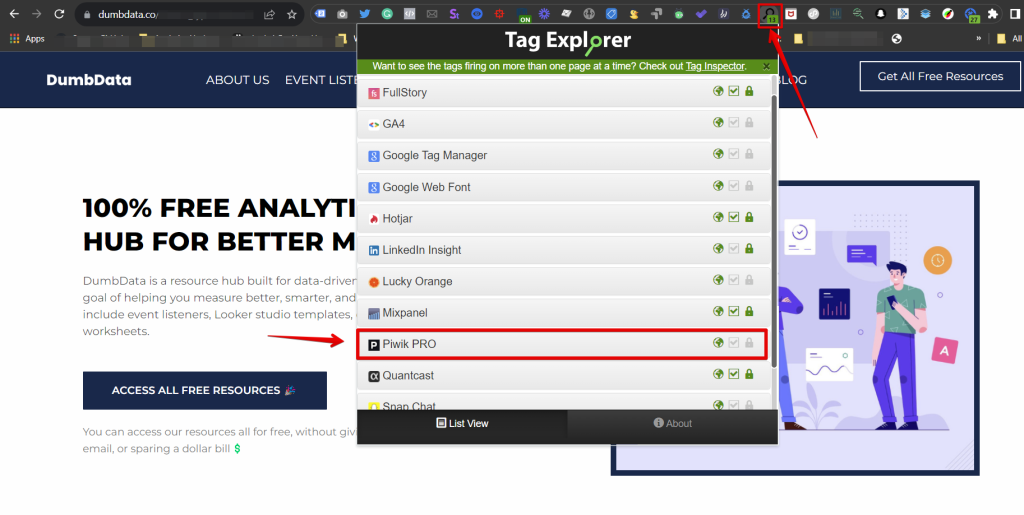
Tag Explorer:
This extension proves invaluable for swiftly verifying which marketing tags are active on the currently viewed webpage and monitoring the beacons that are being activated.
An advanced application unrelated to Piwik Pro debugging involves analysing the hierarchical order of tag loading. InfoTrust owns the extension, and you can locate it via this link.
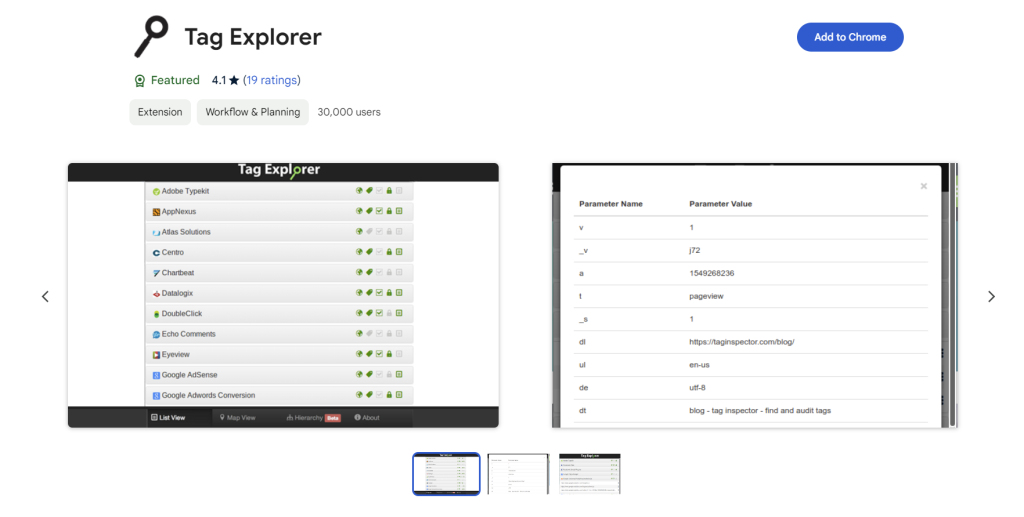
Once added, pin it to your browser’s list of extensions. Unlike some of the tools we’ve discussed earlier, you don’t access it in the developer tools.
Omnibug:
Omnibug is an immensely useful debugging tool, yet I’ve struggled to identify a practical application for it in the context of Piwik Pro debugging.
You can find the Chrome extension version of this tool here.
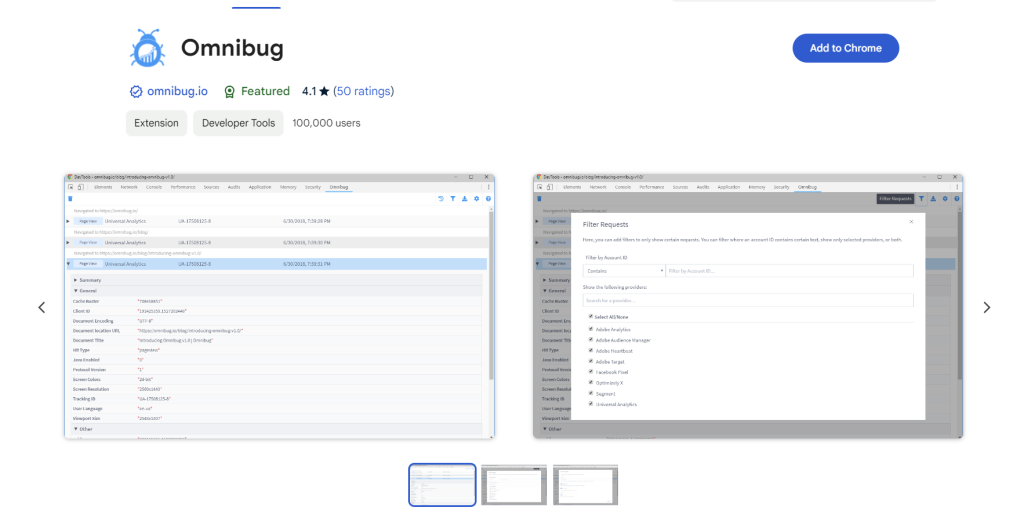
Ross Simpson initially developed the tool, and ownership later transitioned to Philip Lawrence, who was, at that time, a prominent Omnibug contributor actively enhancing the extension.
Similar to “Analytics Debugger” and the “WASP extension,” Omnibug introduces a new tab within the browser developer tool.
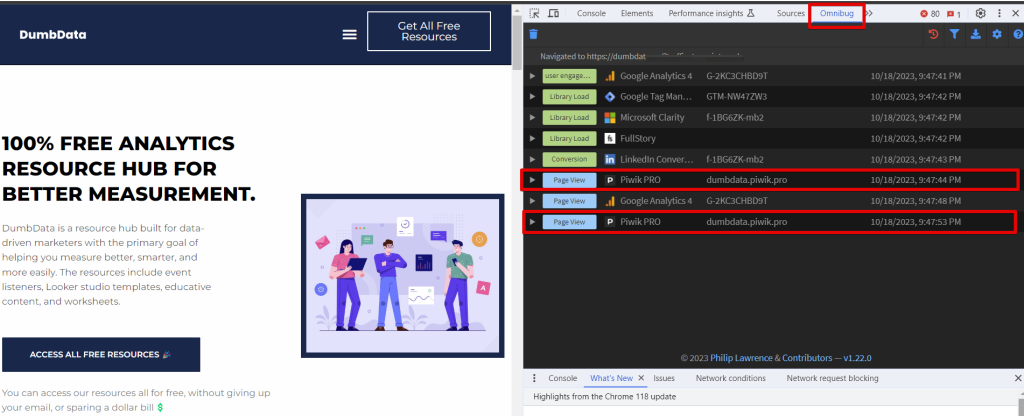
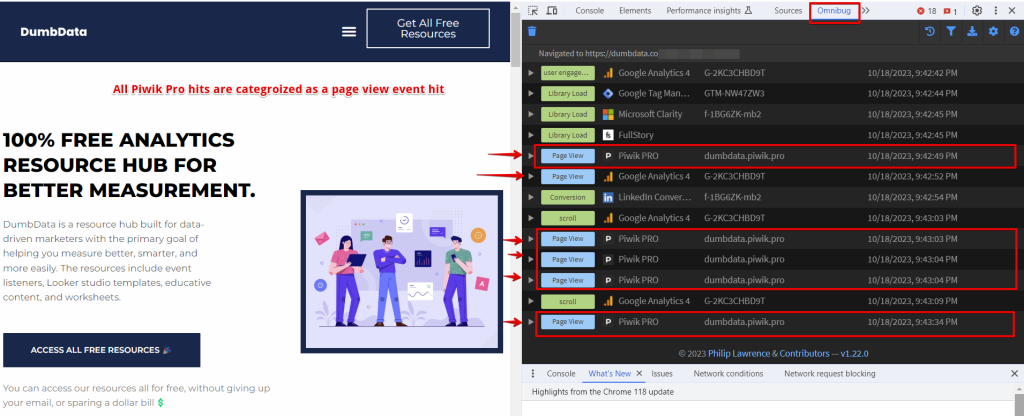
When it comes to debugging your Piwik Pro implementations with this tool, the limitation arises from the fact that all Piwik Pro analytics requests are categorised as “page view” events with no additional contextual information on the request.
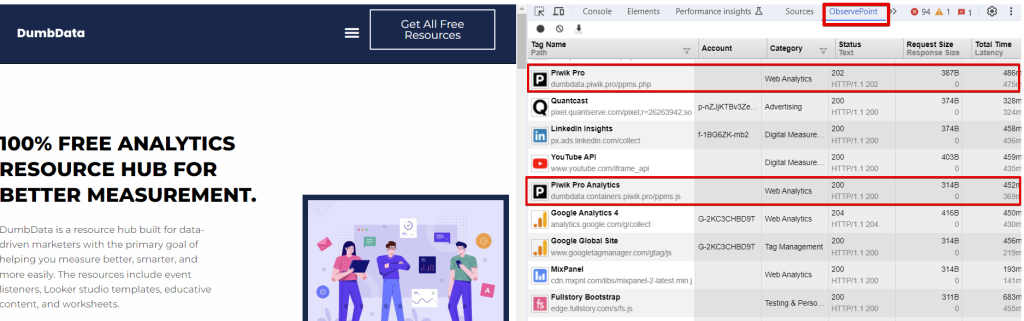
Observe Point:
Observe Point, like the other tools I’ve mentioned, is a renowned industry name. You’ll be using the Chrome “Observe Point Tag Debugger” for your Piwik Pro debugging needs, accessible via this link in the Google Chrome web store.
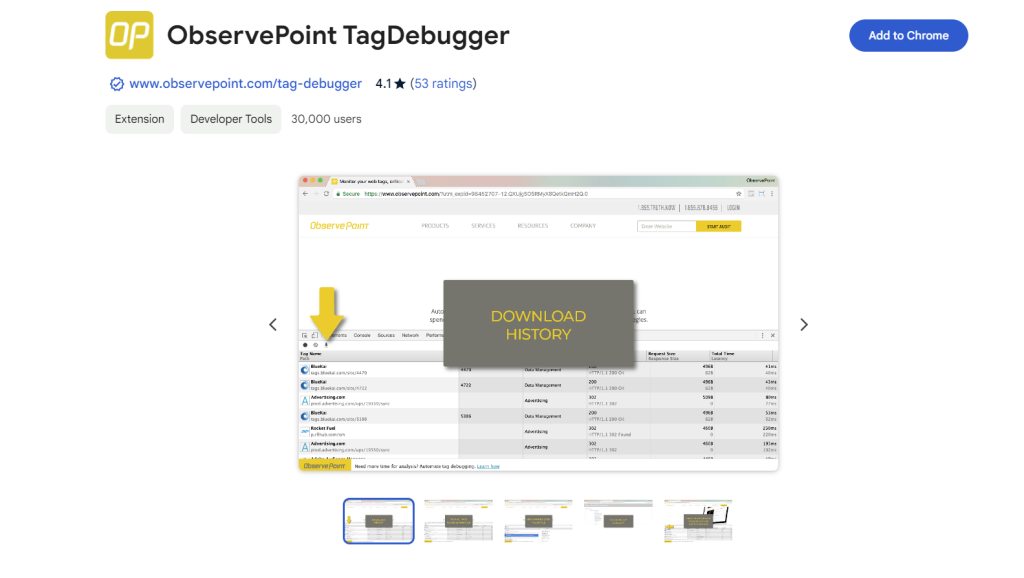
The extension also integrates an additional tab into the Google Chrome developer tool. In my experience, it has primarily proven useful for confirming the presence of Piwik Pro among the various marketing technologies currently installed on a website.
Analytics Inspector:
Built by True-Metrics, this extension boasts a user-friendly interface and offers compatibility with numerous vendors.
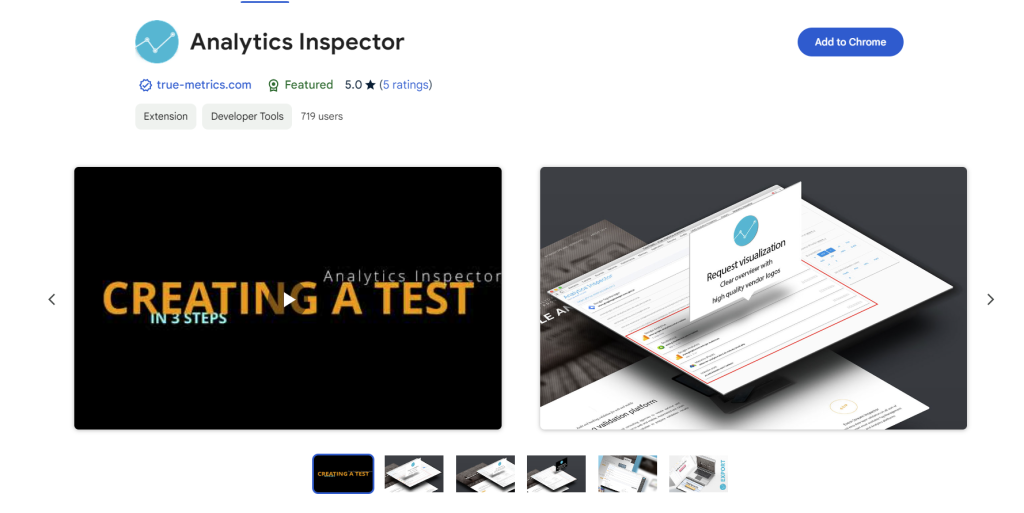
You can access the Chrome extension here. Once enabled, it will introduce its own tab within the browser developer tool, appropriately named “Analytics Inspector.”
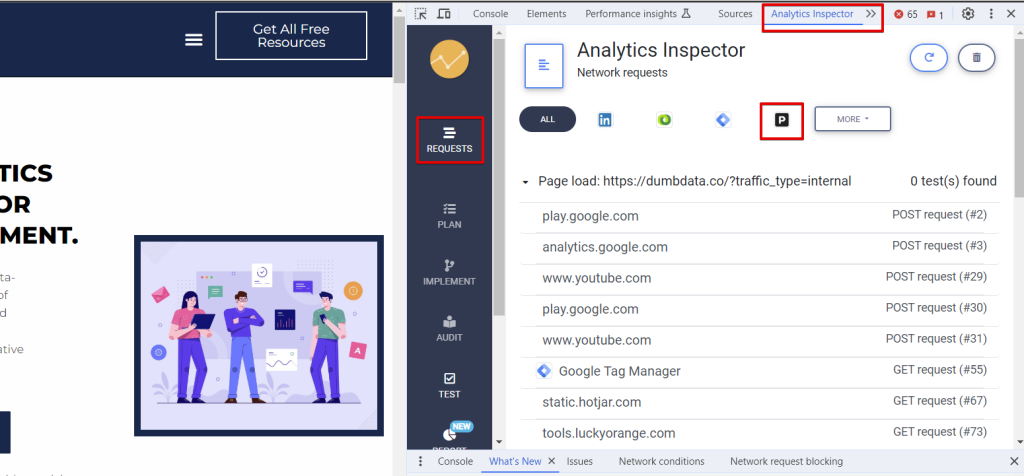
Concerning debugging and validating Piwik Pro Analytics hits, I’ve observed that it only indicates the transmission of a Piwik Pro request without expanding to reveal request details.
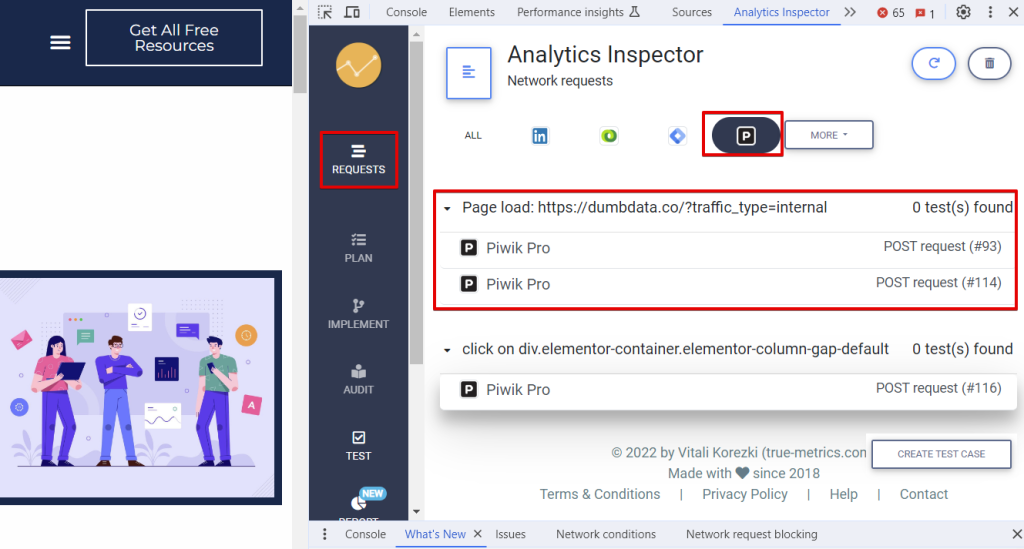
This means you’ll only be aware that a Piwik Pro request was dispatched, but access to specific request details remains currently unavailable. It’s possible this feature may be due to some bug designs, and I hope it gets fixed in the future.
Google Tag Manager or Alternative TMS (Useful in Specific Scenarios)
This isn’t exclusive to Google Tag Manager; it applies to any Tag Management Solution (TMS) you’ve selected to implement Piwik Pro for tracking user interactions on your website.
It’s important to note that Google Tag Manager, or any other TMS, can merely confirm that a tag has fired, offering no further insights. This capability is valuable when you need to ascertain whether your Piwik Pro configurations, like event tracking or custom dimension implementation, execute as intended.
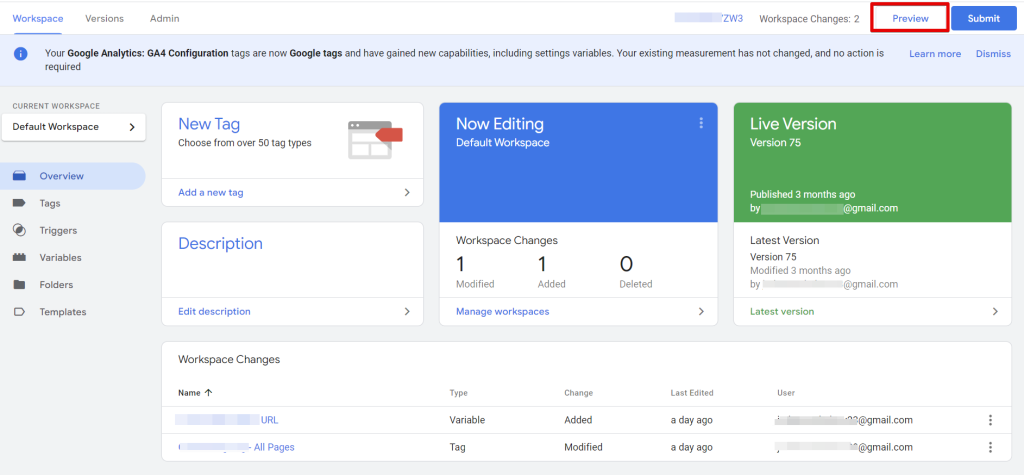
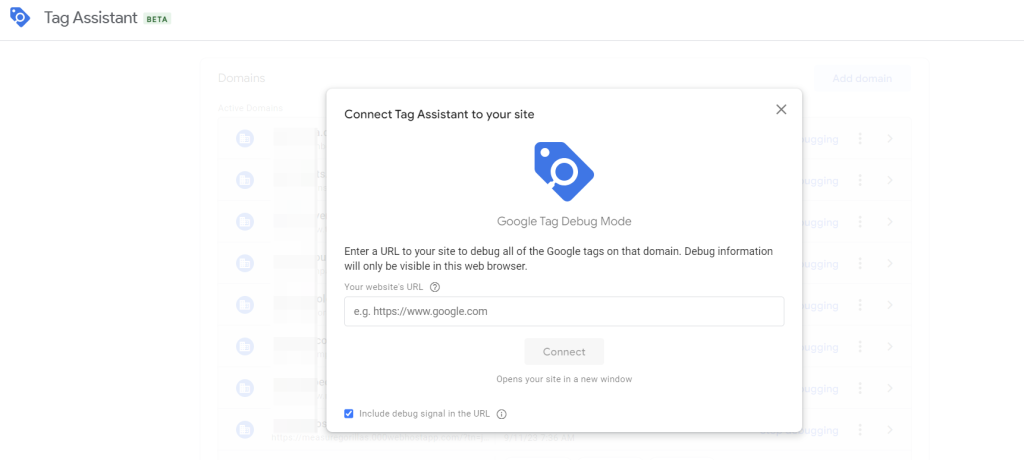
The sole method to verify the firing of your Piwik Pro implementation, including event tracking, custom dimensions, and privacy configuration, in Google Tag Manager is by utilizing the Tag Assistant Debugger in Google Tag Manager.
Please note that debugging through Google Tag Manager or another TMS will not be possible if you have not implemented any form of Piwik Pro tracking (custom event, custom dimension, e-commerce, etc) within that Tag Manager solution.
My Preferred Debugging Approach
My preferred approach to debugging isn’t fixed to a single tool; instead, it involves using various tools flexibly to identify and resolve any issues with my instrumentation. The choice of which tool to use depends on the specific goal of my debugging.
When I’ve just implemented a new tag or customisation in Piwik Pro using the Piwik Pro Tag Manager, I typically use the “Piwik Pro Debug Mode,” “Analytics Debugger,” and “Piwik Pro Tracker Debugger” to verify whether my tracking setup in the Piwik Pro Tag Manager is functioning as intended.
In a case where I’m meant to debug e-commerce instrumentation, especially when it’s done outside the Piwik Pro Tag Manager, like in Google Tag Manager, using the publicly available template we created at DumbData. In that case, I rely on Google Tag Manager’s Debug Mode, “Analytics Debugger,” “Piwik Pro Tracker Debugger,” and the browser console to monitor and diagnose any issues reported in the console.
As for scenarios where I intend to confirm that a website action is correctly tracked as an event, I might opt for using just the “Analytics Debugger” or “Tracker Debugger,” especially if I have access to the Piwik Pro project.
When dealing with privacy-related setups or issues, I turn to the browser console, the “Piwik Pro Tracker Debugger,” and either the “Analytics Debugger” or “Network Debugger.”
For debugging Piwik Pro custom dimension instrumentation, especially session-scoped custom dimensions, I primarily use the traffic detail section in the Piwik Pro Tracker Debugger to examine how the custom dimension values are applied or updated based on the tracking request’s goals. However, “Analytics Debugger” is typically sufficient for event-scoped custom dimensions.
Lastly, in a scenario where I have some instrumentation that was done in Piwik Pro Tag Manager, I mostly opt to use the “Debug Mode” and either “Analytics Debugger” or the “Tracker Debugger” for debugging in these instances.
I hope this conveys the idea that combining different debugging approaches can expedite issue identification and resolution. Sometimes, a single tool or a mix of tools is all you need to pinpoint the problem and determine the necessary solution.
Reflection and Closing Remarks
In closing, I want to emphasise my commitment to keeping this article up to date. The marketing and analytics industry is constantly evolving, and if there are any changes or new debugging tools introduced, I’ll do my best to include them in this article.
Throughout this blog post, we explored the significance of debugging skills for those working on the implementation side of analytics. We delved into a plethora of debugging options available to analytics experts when working with Piwik Pro analytics. Additionally, we provided detailed guidance on using each debugging tool, where to locate them, real-life examples, and any potential limitations they may have.
If there’s a debugging methodology not covered in this blog post or anything you’d like to add or clarify, please feel free to reach out on LinkedIn. I’m eager to hear your thoughts. Until then, happy measuring!