


This article serves two purposes: firstly, to help you understand the website domain(s) for which you are collecting traffic data in your Piwik Pro analytics project, and secondly, to guide you in creating a high-level performance report for your page hostnames where you’ve Piwik Pro implemented. If this aligns with your interests, join me as I go into the details of this blog post.
Spoiler Alert: I’ll also leave you with a tip on how the Piwik Pro alert feature fits into all these and an innovative strategy on how to use it for quality monitoring.
It’s a common oversight to unknowingly collect traffic data from visits to staging domains, spammy domains, or domains not included in your data collection strategy within your analytics tool. We’ve all found ourselves in such situations.
In your Piwik Pro Analytics site project, you may inadvertently collect traffic from a staging domain, a domain you did not intend to track, or even a spammy domain that may have injected your website tracking script. This issue may arise due to:
- Miscommunication with your development team
- Lack of a clearly communicated and laid-out measurement plan outlining which domains should be included in your data collection strategy
- Incorrect tracking instrumentation and trigger configuration in your Tag Management Solution (TMS), especially if Piwik Pro is deployed with a tag manager
- Forgetting to remove Piwik Pro Analytics from the staging domain
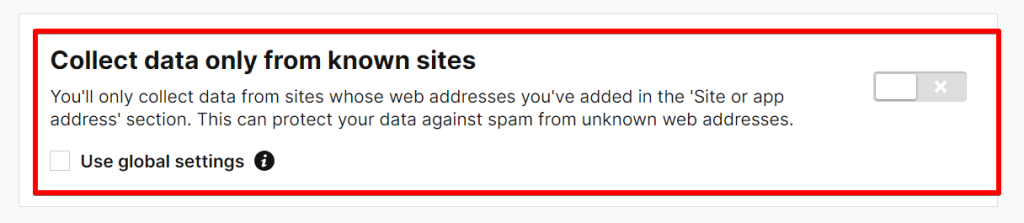
- If you haven’t enabled the “Collect data only from known sites” option, which allows you to collect data only from sites whose web addresses you’ve added in the ‘Site or app address’ section. It’s a strict data collection feature in Piwik Pro that helps protect your data against spam from unknown web addresses.
Note that the feature, by default, prevents data collection for instances where a user accesses your website using Google Translate’s built-in Google search feature.
This article is concise and to the point, aiming to help you identify any issue or missed action item in your data collection strategy at the website domain level.
It is advisable to regularly conduct checks in your analytics tool to examine the hostnames through which data is collected. Several reasons support this practice:
- Gain insight into the domains on which Piwik Pro Analytics is collecting data.
- Identify if any intended domain is not collecting data as it should
- Develop a high-level understanding of the performance of your business domains based on aggregated metrics.
- Detect whether you are collecting data from your website’s staging domain, a spammy website domain, or a business website domain that you do not wish to include in your data collection strategy based on your specific reasons.
- Lastly, confirm that everything is in order regarding the hostnames on which your business, Piwik Pro Analytics, is collecting data.
Having covered these points, it’s worth noting that, as of the time of writing this article, there is no native report that reveals the website domains on which data is collected.
The primary purpose of this article is to demonstrate how to address this gap. Fortunately, the process is straightforward, requiring no additional instrumentation work.
If you’re not familiar with what is possible regarding reporting in Piwik Pro Analytics, you should check out my blog post, which discusses everything about Piwik Pro Analytics reporting.
How to Identify Hostnames Collecting Data in Piwik Pro Analytics + Build a Hostname Performance Report
When you access the Piwik Pro Analytics suite and navigate to the “Report” view, scrolling down to the “Pages” report within the “Behavior” report section, you’ll observe the absence of a native report showcasing the hostnames tracked by your Piwik Pro for user visits.
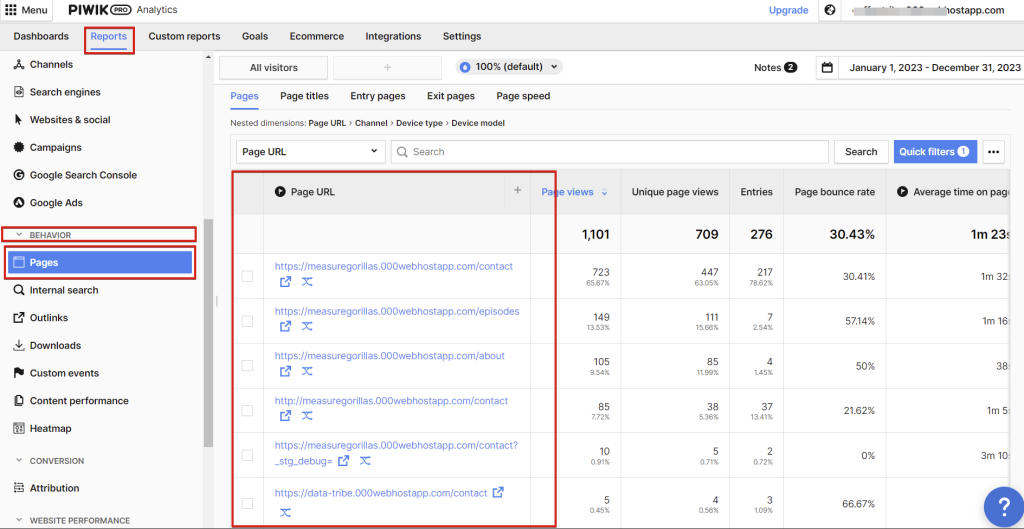
The only alternative is for you to create your own page hostname performance report. The process is simple and straightforward. So, what is the solution?
Piwik Pro “Custom Reports” to the rescue, and here is how to go about it.
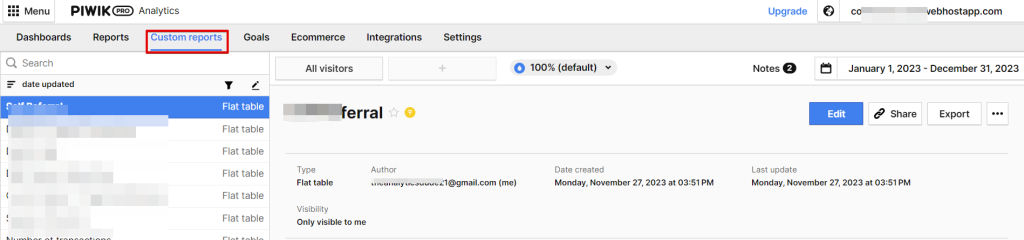
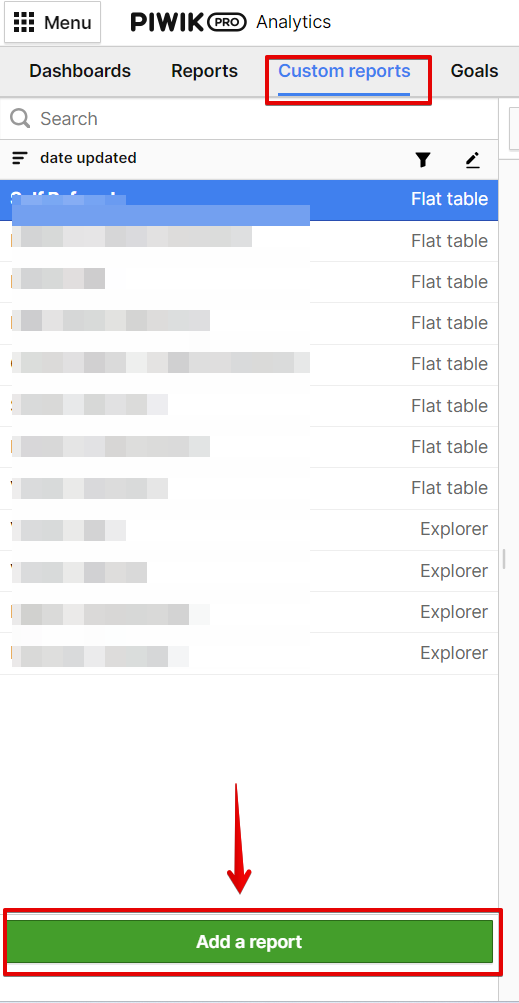
1. Navigate to the “Custom Report” view, where you’ll find a list of the custom reports associated with your Piwik Pro account and site.
2. Click on the “Add a report” button to initiate the creation of a new custom report.
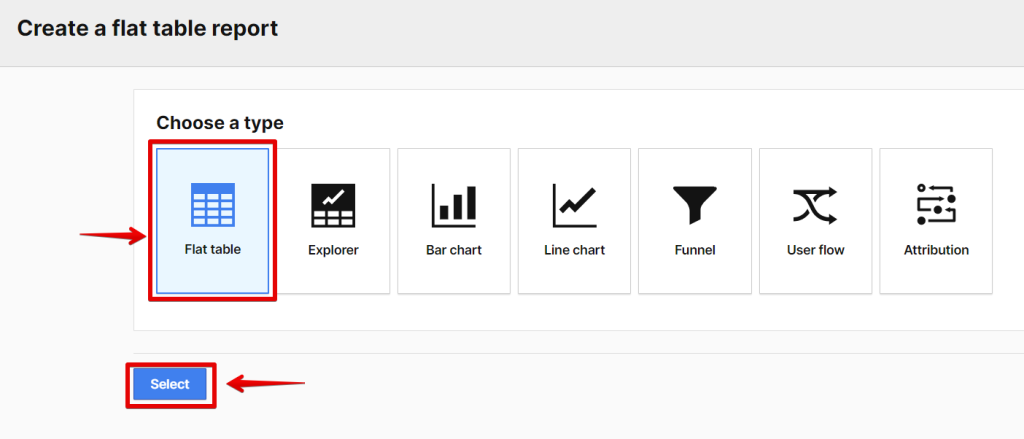
In the “Custom Report” creation view:
3. Choose “flat table” as your report type and click the “select” button to proceed to the actual report build.
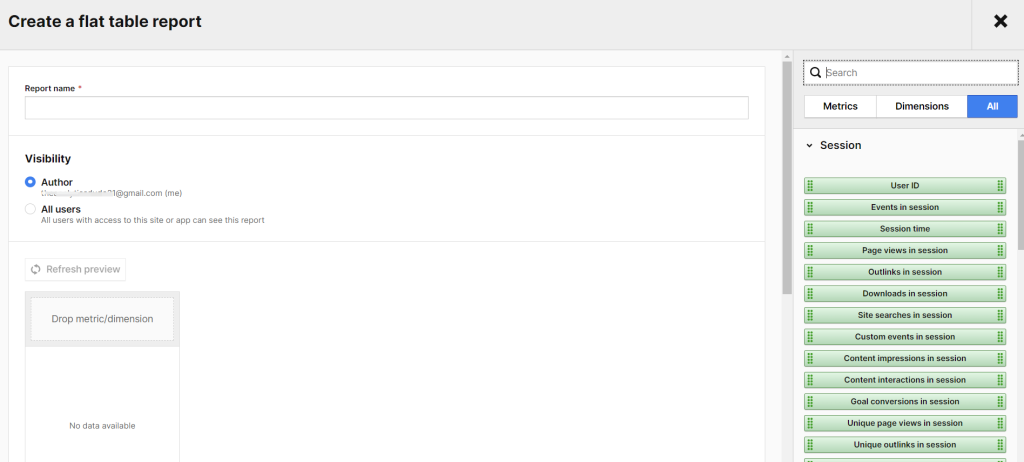
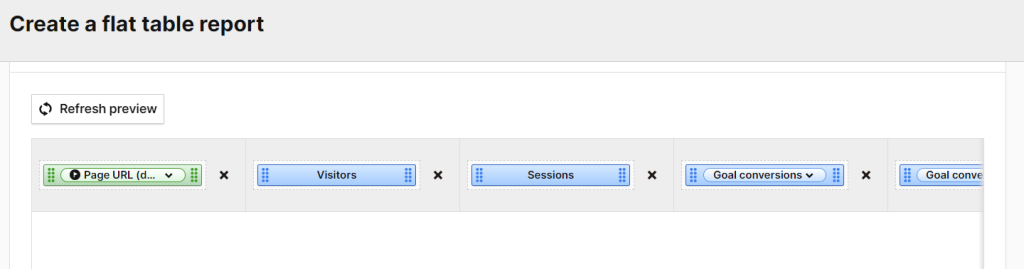
You should have an interface similar to what I have in my screenshot, where metrics are coloured blue and dimensions are coloured green.
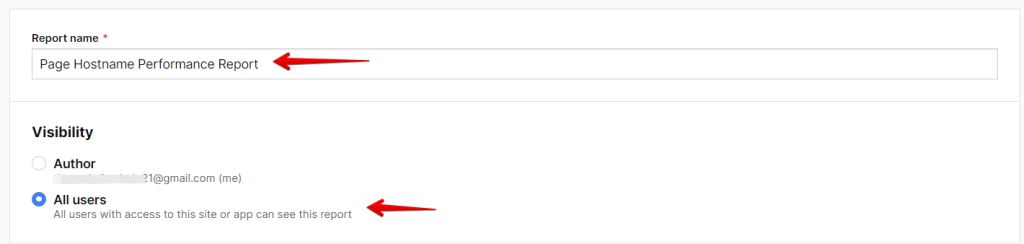
4. Give the custom report a name and click save. Before saving, consider adjusting the “visibility” configuration from “Author” (visible only to you) to “All Users,” making it accessible to other users with Piwik Pro Analytics property access.
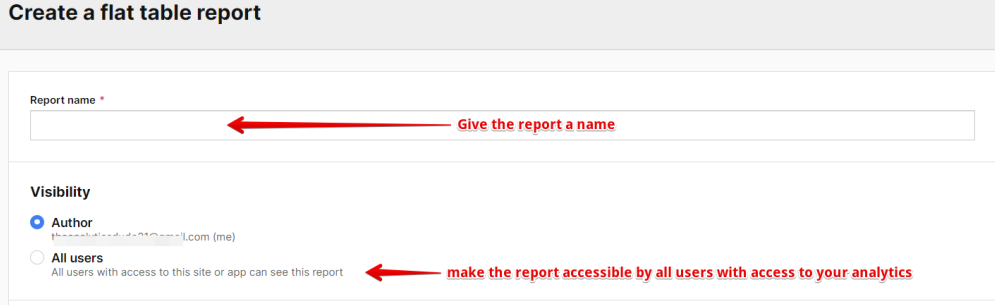
Now, your configuration should be similar to how it is in the image below.
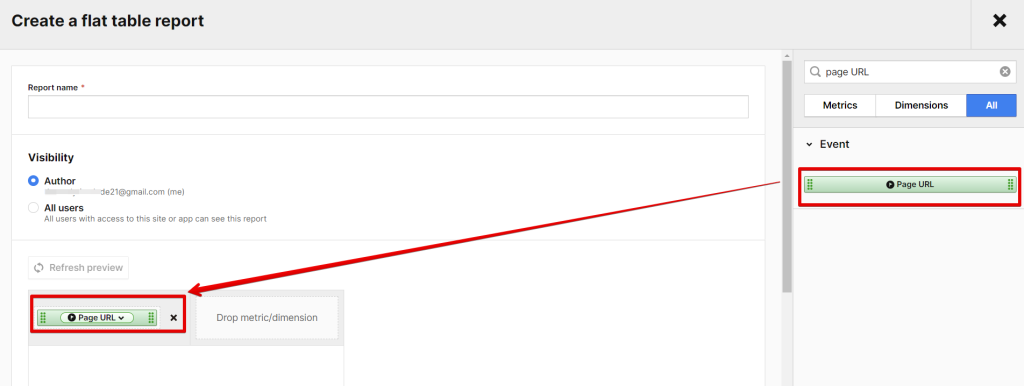
5. Drag the “Page URL” dimension into the report. Don’t worry; we’ll transform it to showcase only the hostnames of the page URLs.
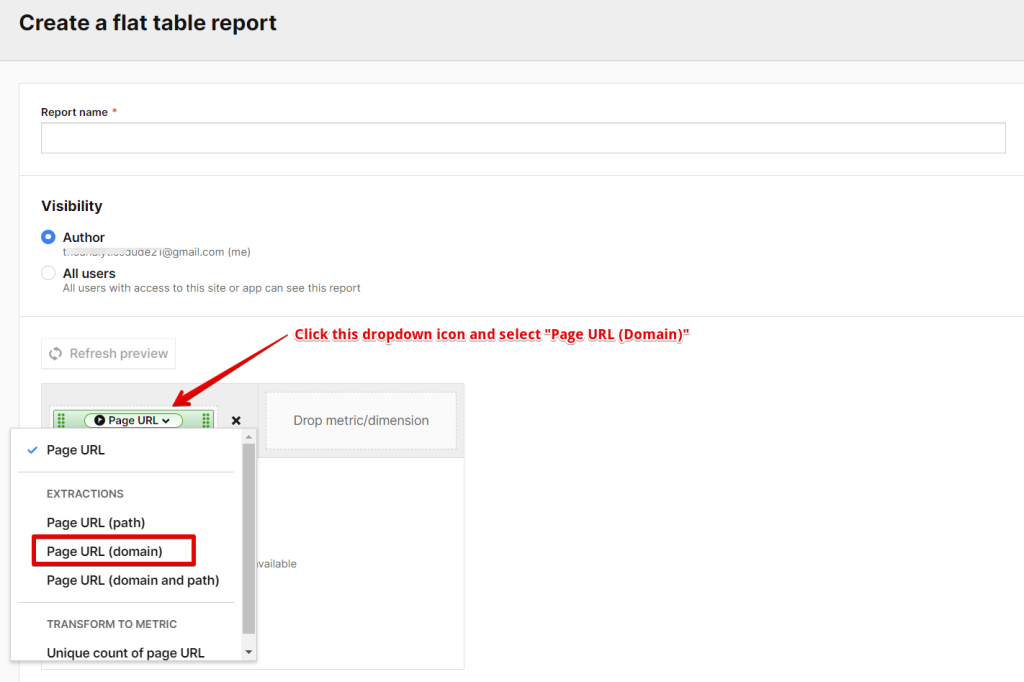
To transform “Page URL” into “Hostnames“:
6. Click the dropdown at the top of the “Page URL” dimension after adding it to your report, and Select “Page URL (Domain)” to report only the hostname of the URL and not the complete page URLs.
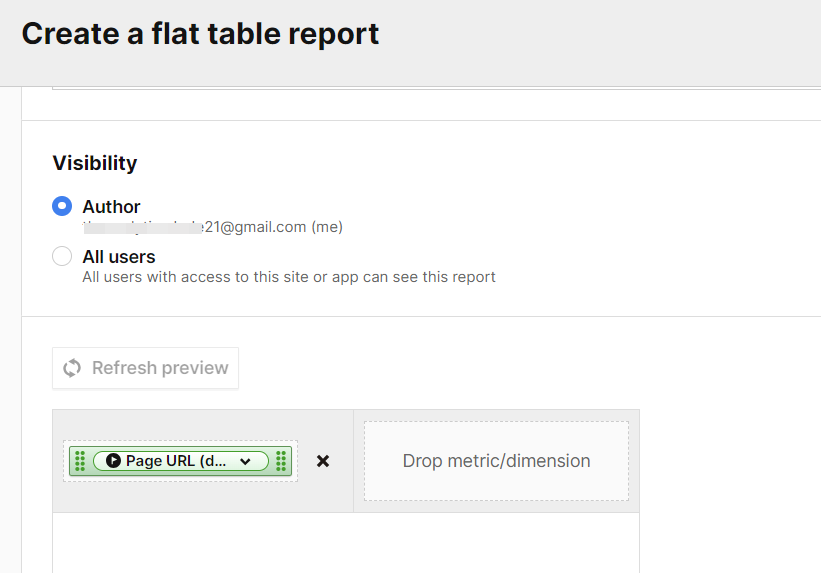
Which ends up like this in your flat table custom report.
The next step is the addition of the metrics to the report:
7. Add the relevant metrics for your business, such as:
- Visitors
- Sessions
- Goal Conversion
- Goals Revenue
- Goals Conversion Rate
- Revenue (for e-commerce), but transform it to (Sum of revenue)
- Orders, etc.
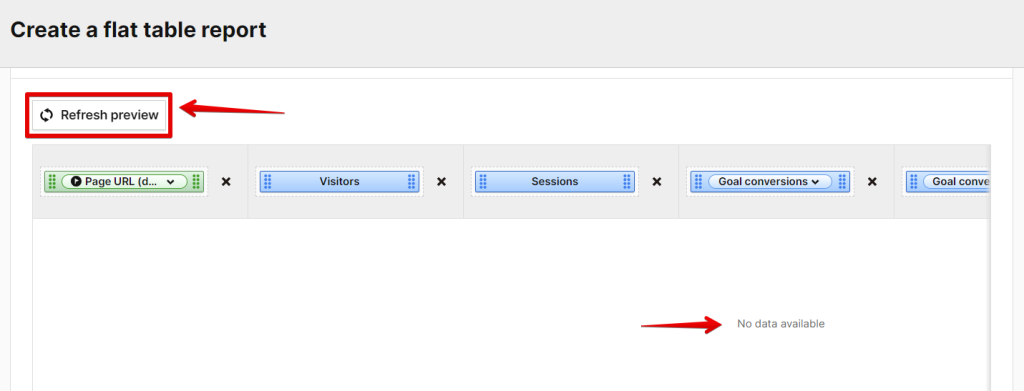
PRO TIP: If the preview table doesn’t display any data during the custom report-building process, click the “Refresh Preview” button to preview the data. If it appears satisfactory, proceed to click the save button.
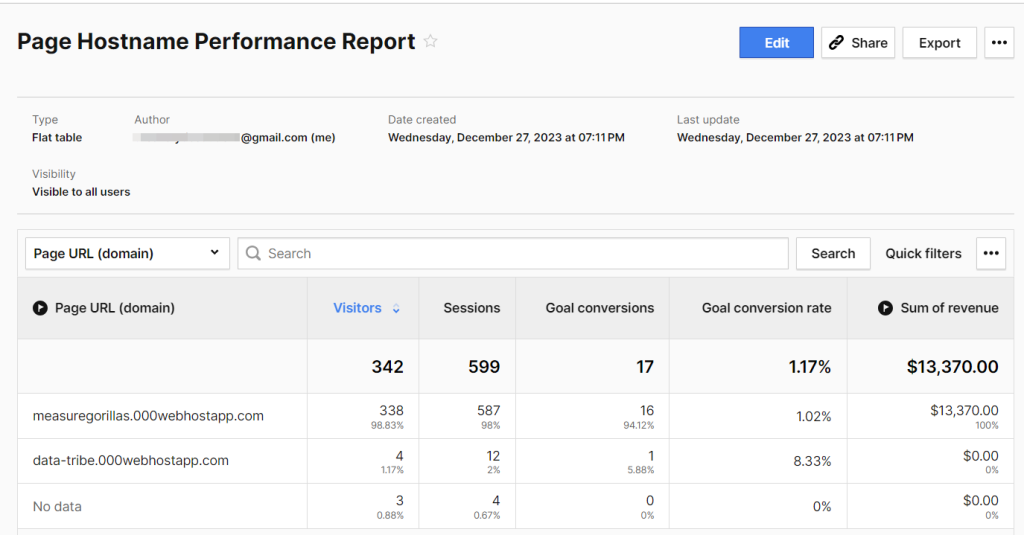
Now, you should be able to view the report, extract the necessary data, and draw insights from the collected information.
The report screenshot allows you to measure, at the website domain level, key metrics such as acquisition, activation, conversions (referred to as goals in Piwik Pro analytics), and engagement performance across the diverse website domains you measure in Piwik Pro analytics.
Closing Remarks:
In conclusion, we have explored the process of creating a website domain performance report in Piwik Pro Analytics. Additionally, we’ve learned how to leverage Piwik Pro Analytics to identify the website domains where your Piwik Pro tracking script is installed, enabling you to discern whether test traffic is being collected on your staging hostnames or if there is a domain you’re not collecting data on.
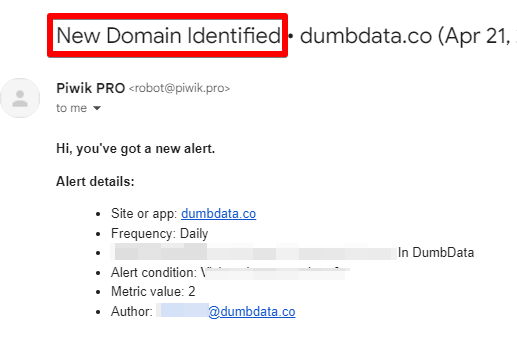
One pro tip I’d like to add is that by innovatively using the Piwik Pro alerts feature (which I’ve covered in this in-depth article about Piwik Pro Alerts), you can proactively monitor data collection on new domains that you don’t own or want to include in your measurement strategy.
Here is one innovative way to use the Piwik Pro alert for quality monitoring without paying for any additional tool.
While this article is concise, I trust that the information covered will prove beneficial during your regular checks.
Finally, if you’re interested in learning more about what reporting options are available when using Piwik Pro analytics, you can check this guide that covers the A-Z about reporting in Piwik Pro Analytics. As for custom reports within Piwik Pro, consider exploring their YouTube playlist. This resource guides you through the intricacies of the Piwik Pro custom reports features and their applications. If you’ve got any questions or need any help, don’t hesitate to reach out via the DumbData team email address or connect with me on LinkedIn. I eagerly anticipate hearing your thoughts. Until then, Happy Measuring!