

On March 6th, Google Consent Mode version 2 (v2) will become fully operational. This update mandates that businesses advertising to users in the EEA region have Google Consent V2 implemented. This update introduces two consent settings: “ad_user_data” and “ad_personalization” storage types. It is crucial that following each implementation, there is a need to debug your consent mode implementation rigorously. This blog post introduces you to several Google Consent Mode debugging tools and privacy tools, ensuring your data collection aligns with Google’s privacy mechanisms.
Recent discussions surrounding Consent Mode reaffirm the pivotal role of privacy in marketing strategies and the continuous trend of Businesses being increasingly held accountable for the data they collect on their customers, underscoring the importance of compliance.
This article will explore various tools for debugging and auditing your Google Consent Mode implementation. It will be concise, focusing solely on the practical aspects of debugging tools without covering the foundational concepts of Google Consent Mode or its setup process. For a comprehensive understanding of Google Consent Mode, I recommend exploring Markus Baersch‘s insightful article on Simo Ahava‘s blog or its German version, which offers an in-depth exploration of consent mode principles.
A Short Overview of Google Consent Mode Version 2
To refresh your understanding, let’s briefly examine what Google Consent Mode version 2 (v2) entails.
At its core, Google Consent Mode v2 represents an evolved approach to privacy compliance initiated by Google due to the effects of privacy regulations like the GDPR and ePrivacy Directive and new legislations such as the Digital Markets Act (DMA).
This framework enhances businesses’ ability to communicate the consent preferences of their website visitors to Google using the Consent Mode API. Utilising these consent signals, Google adjusts the functionality of its measurement tags in alignment with the user’s consent choices.
Consent Mode V2 is built on the foundation laid by the legacy Google Consent Mode (v1), and version 2 introduces two new consent states: “ad_user_data” and “ad_personalization” storage types. Version 2 emphasises the nuanced implementation of “Advanced” and “Basic” consent mode types in the legacy version of Google Consent Mode.
You should see this as Google’s strategy for enabling businesses to collect data on website conversions and user behaviour in a manner that respects users’ privacy choices.
With this overview in place, let’s transition to discussing some of the tools available for debugging your Google Consent Mode implementation.
These tools are compatible with various Consent Management Platforms (CMPs) and can be utilised regardless of whether Google Tag Manager (GTM) is your chosen Tag Management Solution.
Tools for Debugging Google Consent Mode Implementation
The analytics industry community has played a pivotal role in providing essential resources that help in the correct setup of Google Consent Mode, including educational resources, tips, and tools.
This contribution has helped create tools that support debugging and auditing your consent mode implementation. In no specific order, the following tools are invaluable for identifying implementation errors and ensuring that your implementation aligns with best practices:
- Consent Mode Inspector by InfoTrust
- Google Consent and Privacy Reporter by David Vallejo
- Google Tag Assistant (Consent Tab)
- Analytics Debugger by David Vallejo
- Cookie Compliance Audit Tool
- DataLayer Checker
- Verified Data by Brian Clifton
- Browser Developer Tools:
Let’s now take a look at the capability of each of these tools.
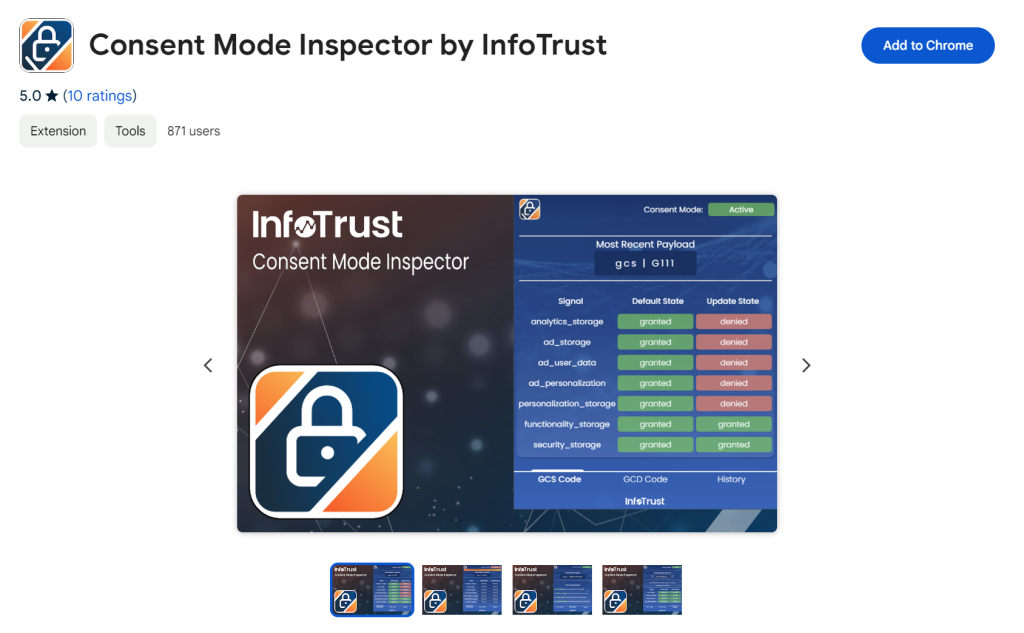
Consent Mode Inspector by InfoTrust
Developed by InfoTrust, the Consent Mode Inspector is a powerful Chrome extension designed to help quickly audit and debug the configuration and behaviour of website Google consent mode settings in real-time. To use this tool in your workflow, navigate to the Chrome Web Store and install the extension via this link.
Key Features of the Consent Mode Debugging Extension:
Real-Time Google Consent State (GCS) Display: The tool instantaneously reveals the most current Google Consent State included in requests sent via your Google Tag, ensuring immediate visibility.
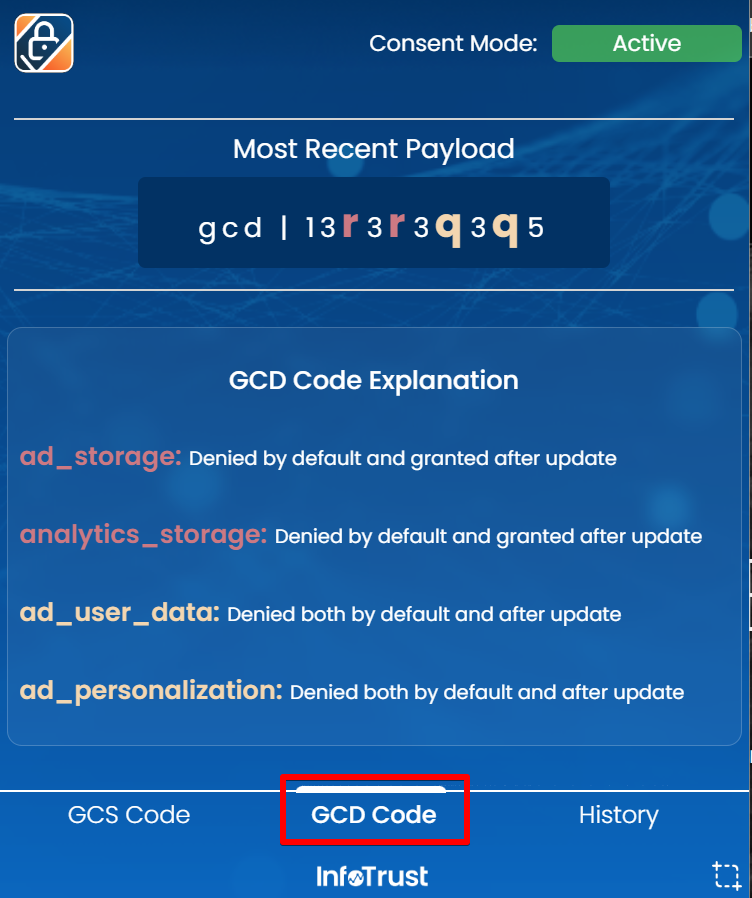
Detailed Google Consent Decision (GCD) Code Insights: This feature demystifies the latest GCD code, providing a friendly explanation for each value and enhancing your understanding of this privacy parameter.
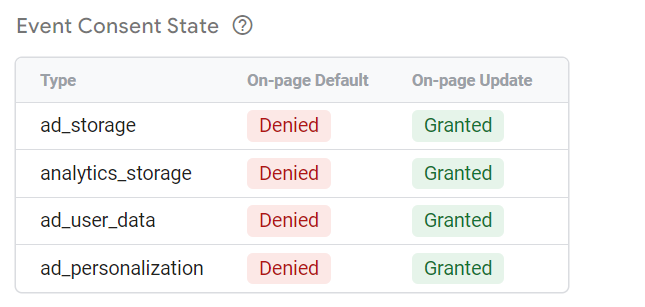
Dynamic Table View: Directly interact with the “google_tag_data.ics.entries” object retrieved from the Document Object Model (DOM) to help you understand the status of the different consent storage types.
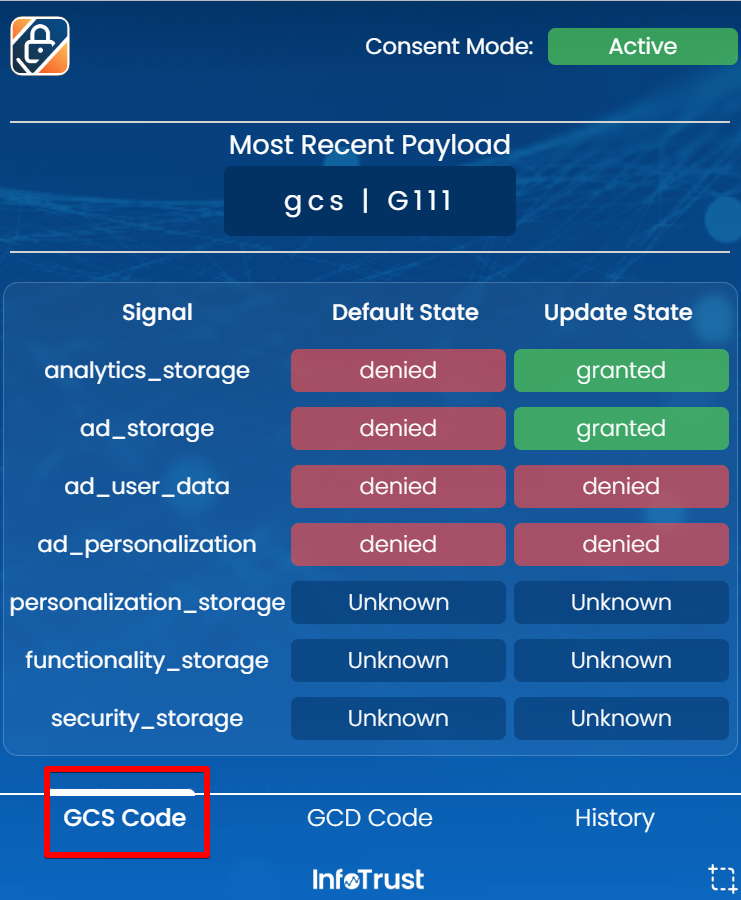
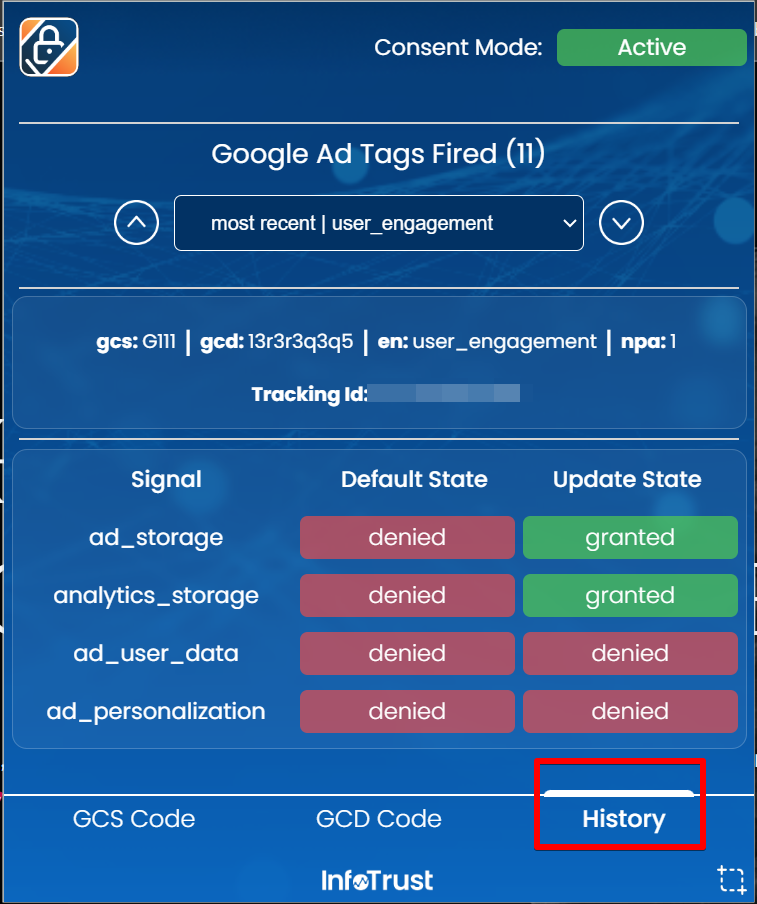
Consent History Tracking: Maintains a log of tags triggered, including GCS codes and their respective consent states at activation, facilitating historical analysis to identify if everything is working as expected.
One-Click Screenshots: The Consent Mode Inspector tool can effortlessly capture screenshots of the extension’s interface, allowing for easy sharing of consent results with colleagues or documentation purposes.
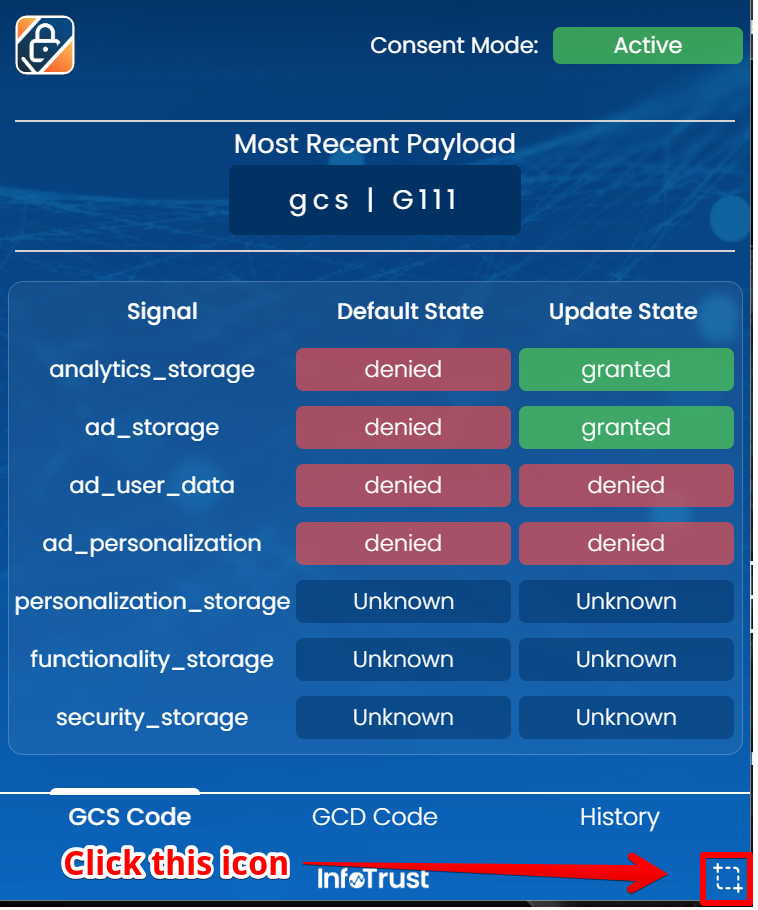
All you have to do is navigate to the tab you want to save as a screenshot and then click the “crop” icon to save that tab as an image.
Using the Consent Mode Inspector by InfoTrust:
For you to use this tool, it starts with installing the Chrome extension, pinning it to your browser, and then visiting the website you want to audit.
Upon visiting the website, the colour of the Chrome extension determines whether Google Consent Mode is present on the website or not.
If it’s red, as shown in the image below, it means GCM isn’t set up for the website.
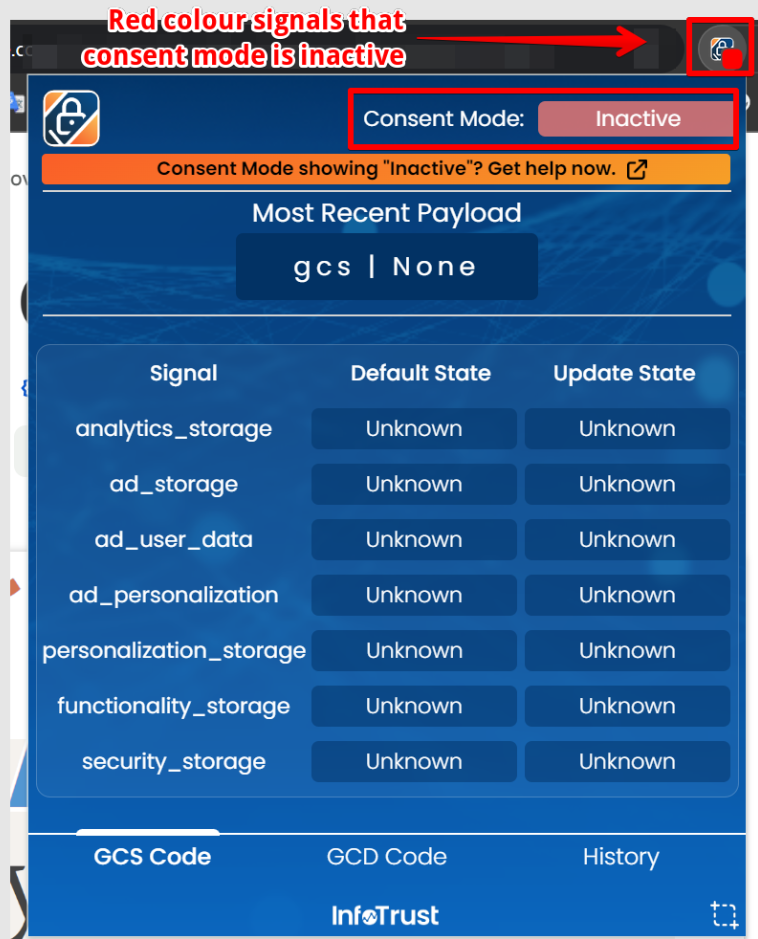
If it’s green, there is a consent mode setup.
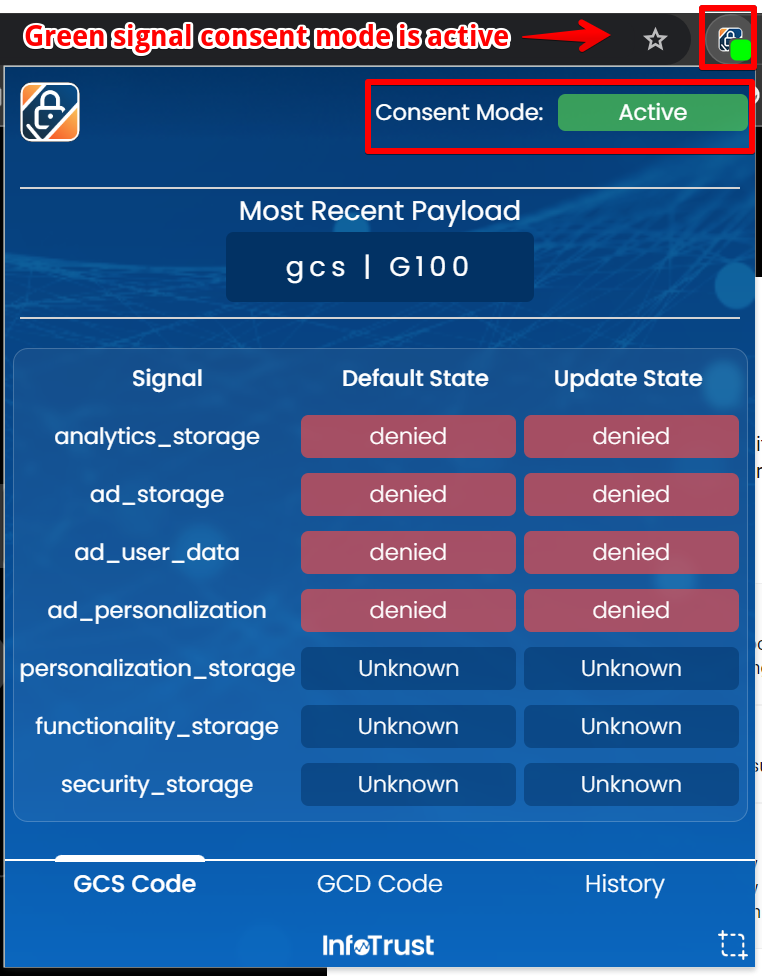
Clicking on the Chrome extension icon will help activate the debug view. It will then provide detailed insights into the site’s consent mode, including default and updated behaviours after you’ve interacted with the “Consent Banner” on the website.
Given that the tool is free, Why not explore its capabilities today?
Google Consent and Privacy Reporter
Previously known as the “Google Consent Decipher Tool” before being rebranded to “Google Consent and Privacy Reporter,” this invaluable resource was developed by the esteemed expert David Vallejo. It serves as an interpretive tool, translating the Google Consent configuration settings of your Google Analytics 4, Google Ads, or Floodlight hit requests into clear, easily understandable English.
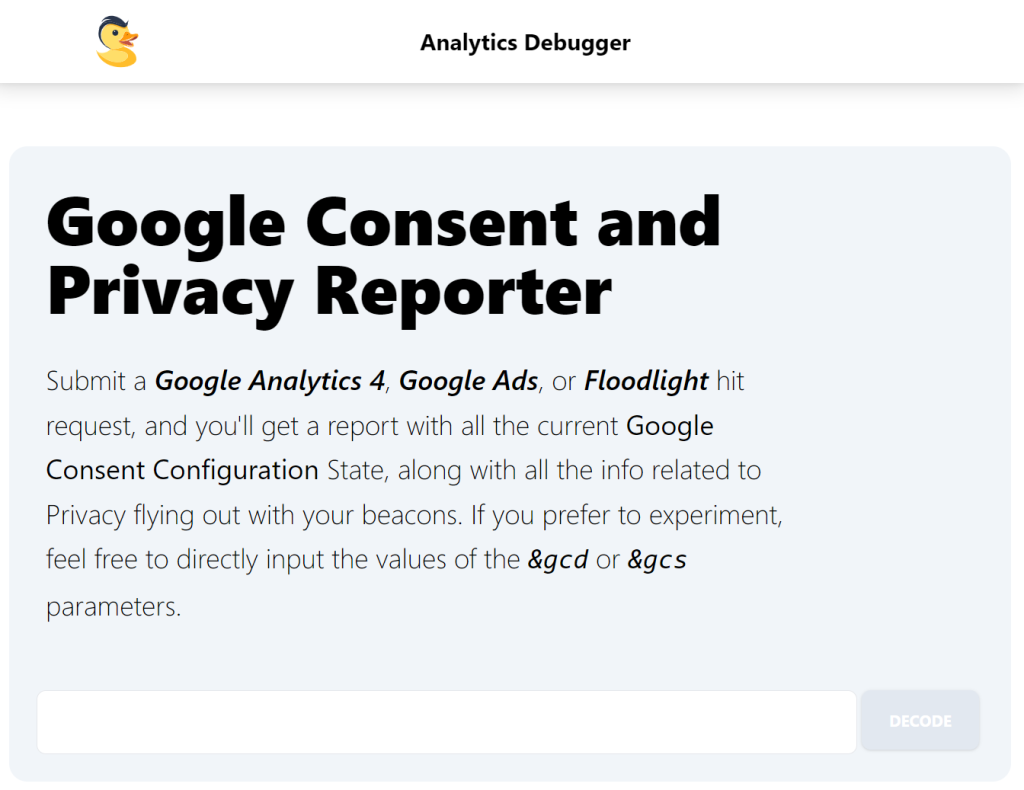
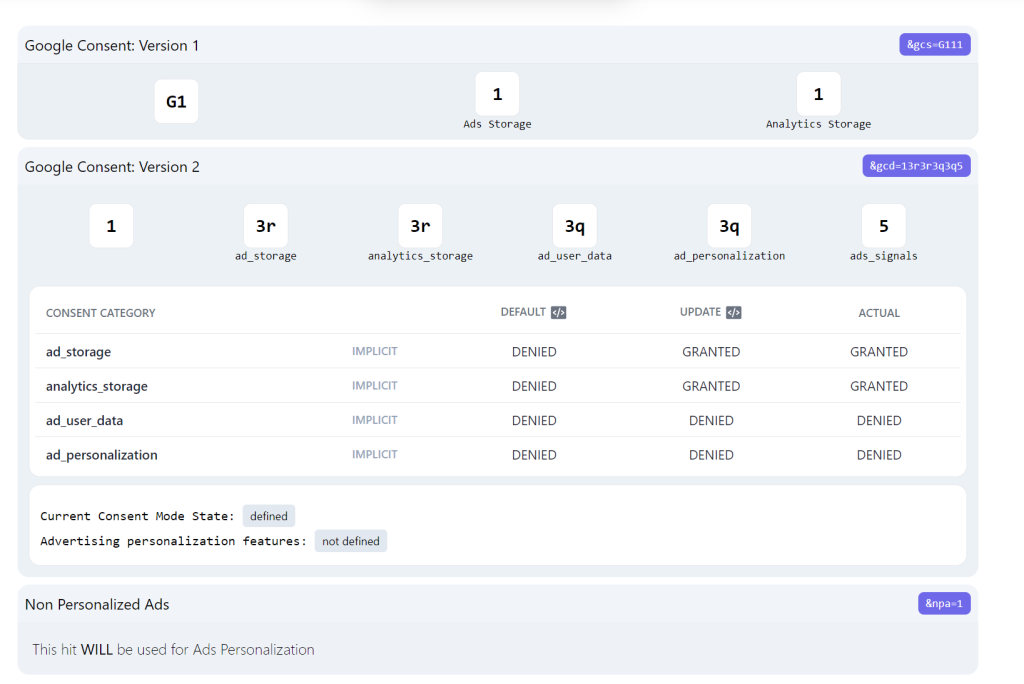
This tool demystifies each parameter related to consent, providing a full breakdown of the “&gcd” value. It deciphers the numbers preceding the consent statuses and the final digit in the string, offering a user-friendly explanation of what these parameters signify and whether the request complies with consent regulations.
Extending its utility beyond Google Consent Mode v2, the tool also supports the legacy Consent Mode, delivering detailed analysis and comprehensive insights on the US Privacy Signal in Google Pixels requests. Moreover, it encompasses reporting and decoding capabilities for the Transparency & Consent Framework (TCF) v2.
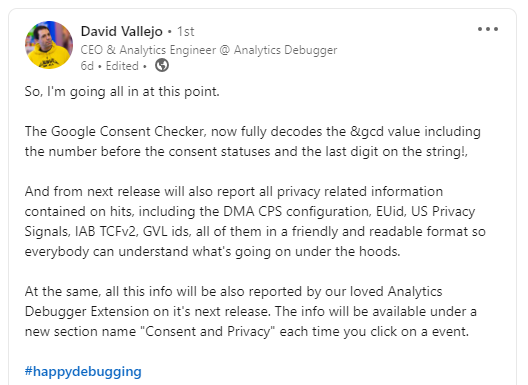
You can access the Google Consent and Privacy Reporter tool with this link, and David Vallejo has announced plans to integrate it with the “Analytics Debugger,” further enhancing its functionality.
By utilising David’s Google Consent & Privacy Reporter, users can:
- Access a report group of various privacy compliance checks (Consent Mode v1, Consent Mode v2, CPS, DMA) into report groups.
- Determine whether consent was implicitly set or explicitly declared.
- Simulate GTAG API Calls for a deeper understanding of consent interactions.
- Access clearer CPS reporting for DMA analysis.
To leverage this tool, you need to extract the Google Analytics 4, Google Ads, or Floodlight hit request from your browser’s network tab or directly input the values of the “&gcd” or “&gcs” parameters.
Google Tag Assistant (Consent Tab)
The Google Tag Assistant debug interface has a dedicated Consent Tab that offers a streamlined interface for debugging consent mode implementations on a website.
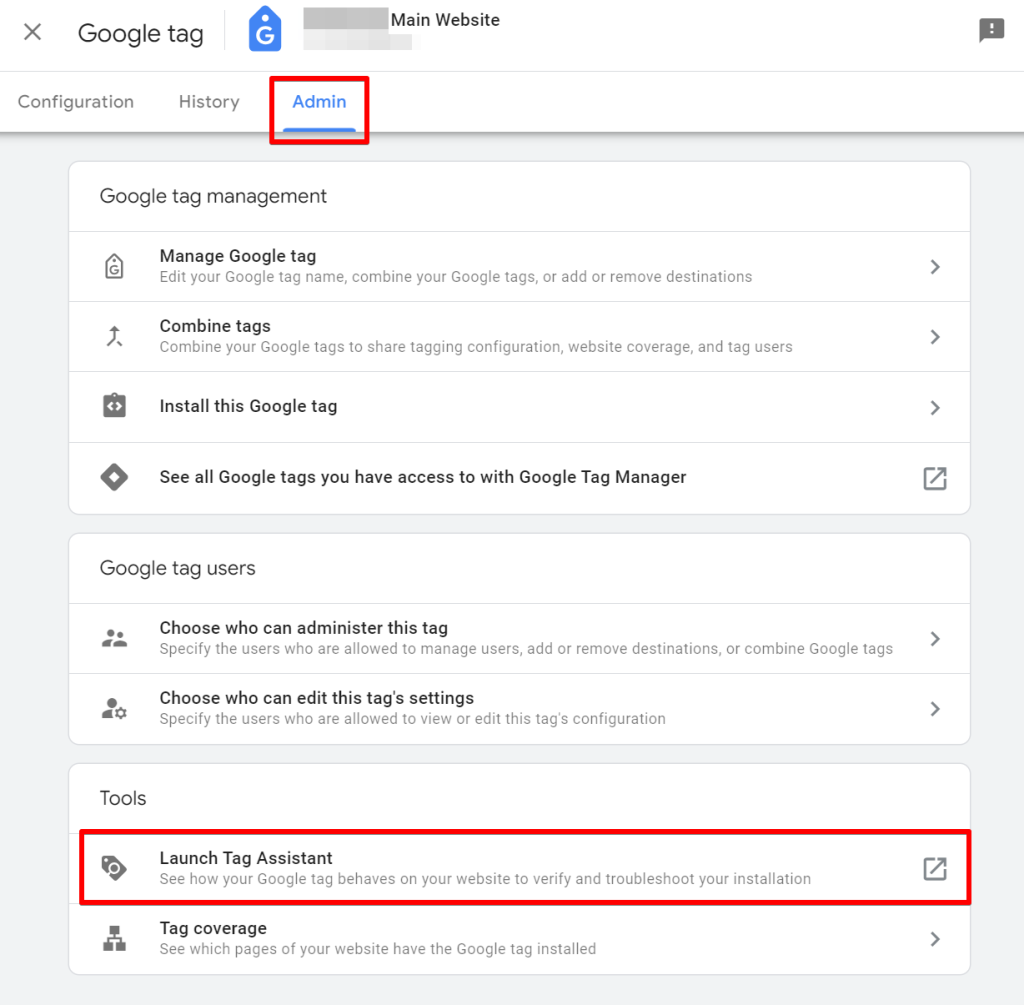
This tool is readily accessible through the “Preview mode button” within Google Tag Manager and directly from the Google Analytics 4 (GA4) and Google Ads user interfaces.
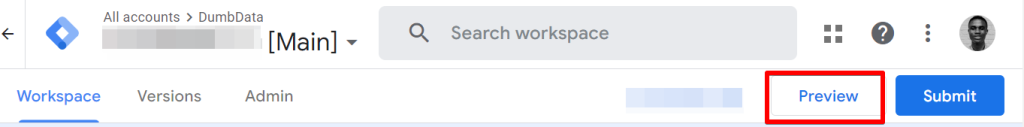
Where to find the tag assistant launch button in GA4.
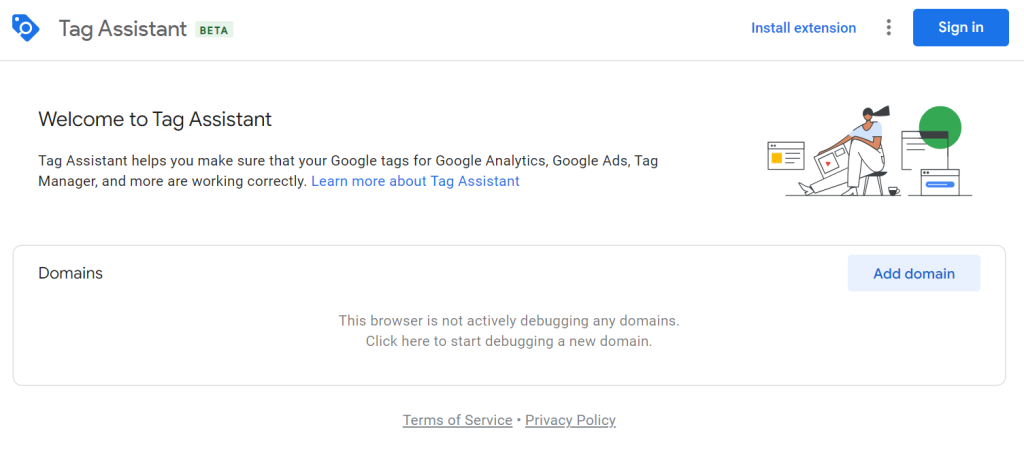
Alternatively, you can initiate your debugging session by visiting the Google Tag Assitant URL to enter the debug environment.
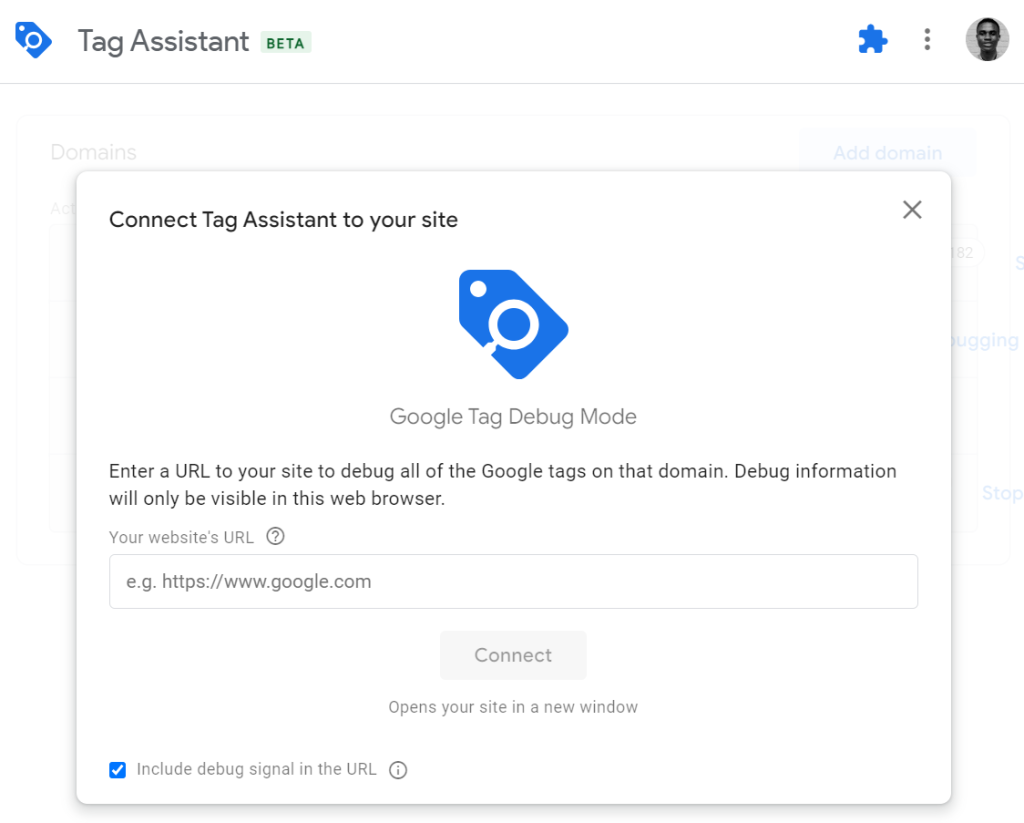
To begin debugging the consent implementation on a specific website, simply enter the website’s URL into the provided field and click the “Connect” button. This action will redirect you to the Google Tag Assistant debug environment.
Within this interface, regardless of whether you’re on the GTM, GA4, or Google Ads tab, you’ll find a “Consent” tab. This section delivers detailed consent state information for Google Analytics 4, Google Ads or Floodlight hit requests.
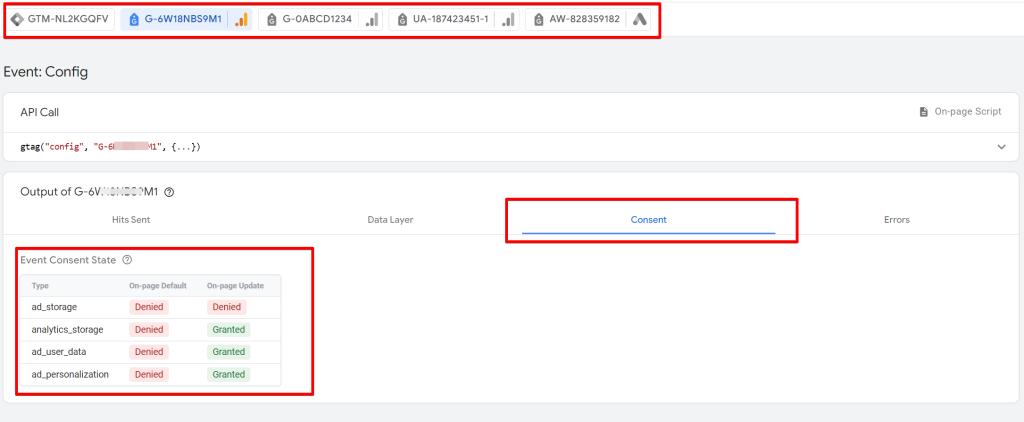
Remember that to access the consent state details in the “Google Tag Manager” tab, you must have access permission for the Google Tag Manager Container in question.
Notably, this tool is versatile and remains functional even in the absence of a Google Tag Manager container on your website. It is still helpful for debugging consent mode implementations even with only the presence of any Google Tag on the site in question.
Leveraging the Google Tag Assistant (Consent Tab) not only simplifies the process of consent state verification but also ensures that your site’s data collection practices are aligned with user consent preferences, thereby upholding privacy standards.
Analytics Debugger by David Vallejo
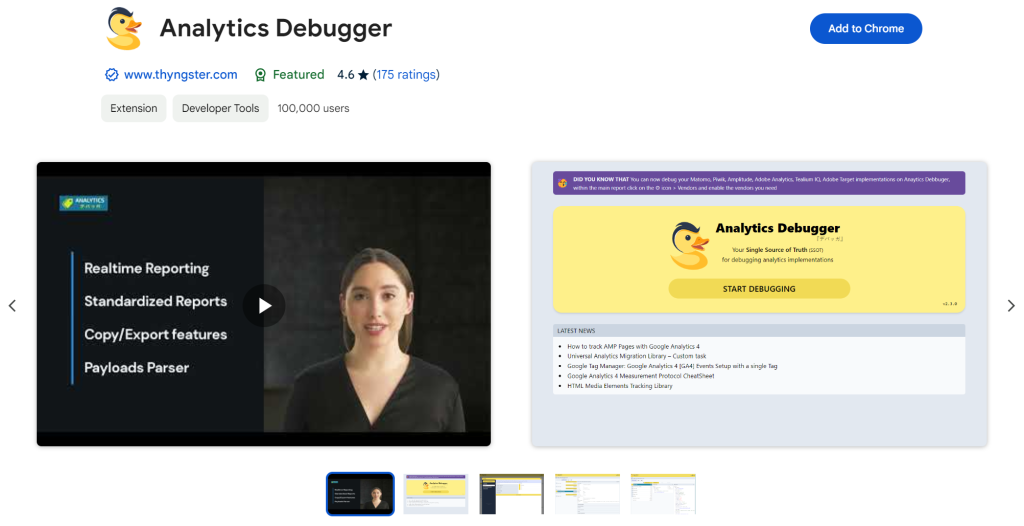
It is one of the essential tools for every analytics professional. The Analytics Debugger, developed by the great David Vallejo, is an indispensable component of a digital analytics specialist’s toolkit, especially for those dealing with marketing pixels and leveraging Google’s marketing and measurement tools.
The tool is renowned for its capability to debug analytics implementations across various vendors and extends its utility to debug consent mode setups. It enables users to ascertain whether their Google tag requests are compliant and verifies the implementation of Google Consent Mode on their websites.
David Vallejo’s recent announcement that this Chrome extension will integrate consent reporter tool capability into the Analytics Debugger Extension advances its indispensability. This enhancement positions it as a powerful asset for technical marketers.
The Analytics Debugger is accessible in the Chrome web store through this link and can be installed on your Chrome browser.
After installing the extension, you can commence its use by simply opening the browser’s developer tools and navigating to the “Analytics Debugger” tab, assuming the Chrome extension has already been installed.
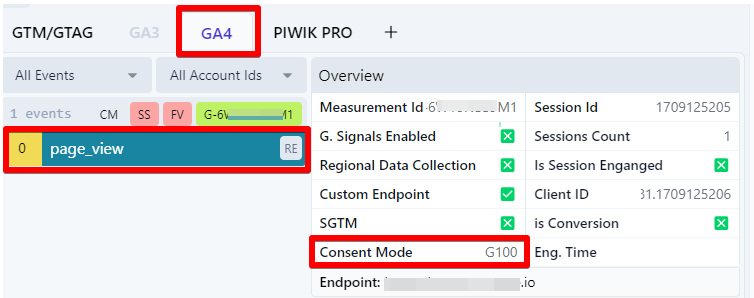
In the GA4 vendor tab, you can identify if the “Google Consent Mode” parameter is associated with your analytics hit request and what the status is, as shown in the image below.
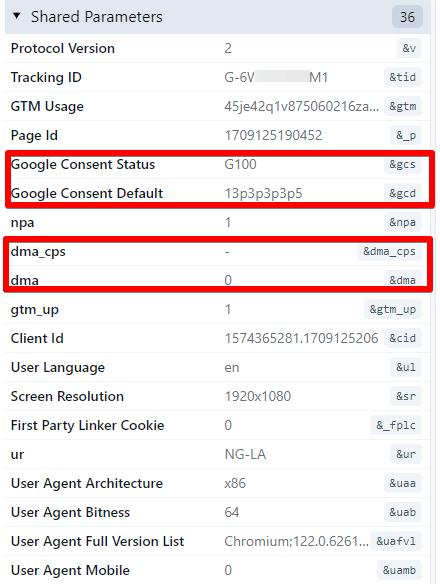
Navigating to the “Shared Parameters” section, provide more consent and privacy-related information, such as the GCD, DMA-related request, etc., in a more friendly and easy-to-understand way.
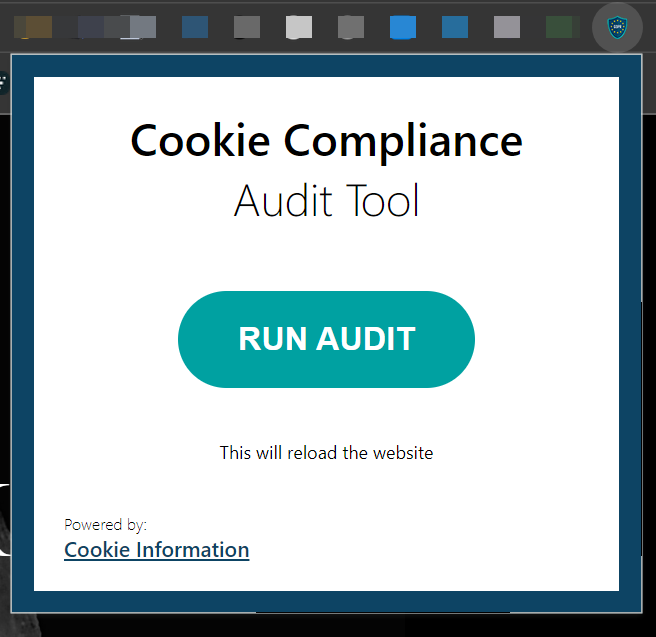
Cookie Compliance Audit Tool
I want to clarify that the Cookie Compliance Audit Tool is not designed for debugging or auditing your Google Consent Mode implementation. Instead, its primary function is to conduct a preliminary complaint audit of your Consent Management Platform (CMP) design and cookie deployment, and it does this by analysing a single URL on your website.
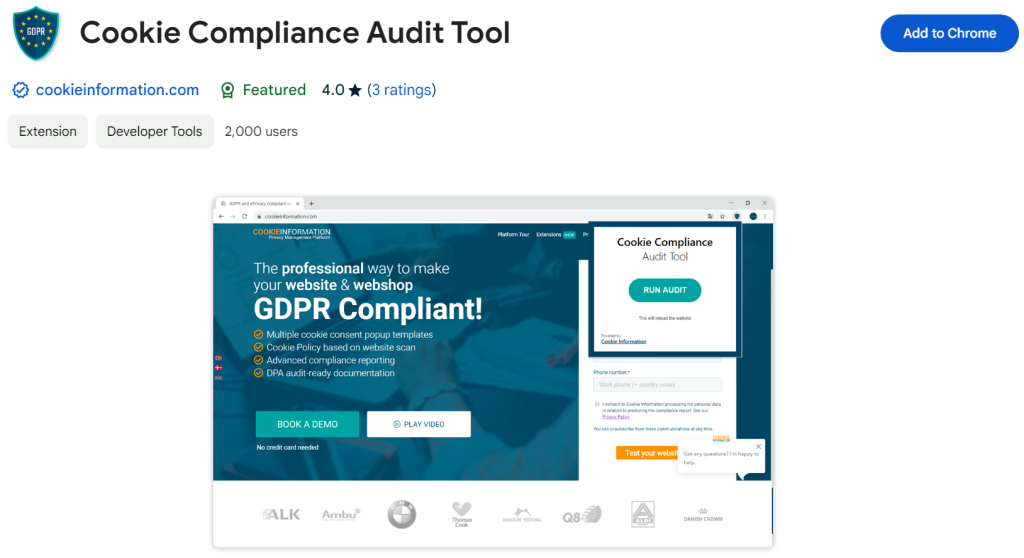
The tool assesses whether your website’s consent banner aligns with the GDPR and ePrivacy directives, offering a quick foundational compliance review.
Developed by CookieInformation, a provider of CMP solutions, this tool is available as a Google Chrome browser extension. It facilitates a quick DIY examination of your website cookie behaviour and consent banner design to identify potential non-compliance issues according to GDPR and ePrivacy standards. However, it’s essential to recognise that the scope of this test is limited.
Beyond design compliance, the extension evaluates overall cookie compliance. Using a single website URL, it examines whether it fulfils the necessary criteria to comply with current personal data protection regulations, including ePrivacy and GDPR. Key aspects assessed by the tool include:
- Data sharing practices.
- The presence and functionality of a cookie consent pop-up.
- The option to opt out of cookies.
- The enforcement of prior consent (i.e., withholding cookies until consent gets granted).
- The existence of a comprehensive cookie policy.
An essential precaution to note is that activating the extension for an audit will clear all cookies from the audited webpage, potentially resulting in being logged out from your Google accounts. It is hoped that future updates will address this inconvenience.
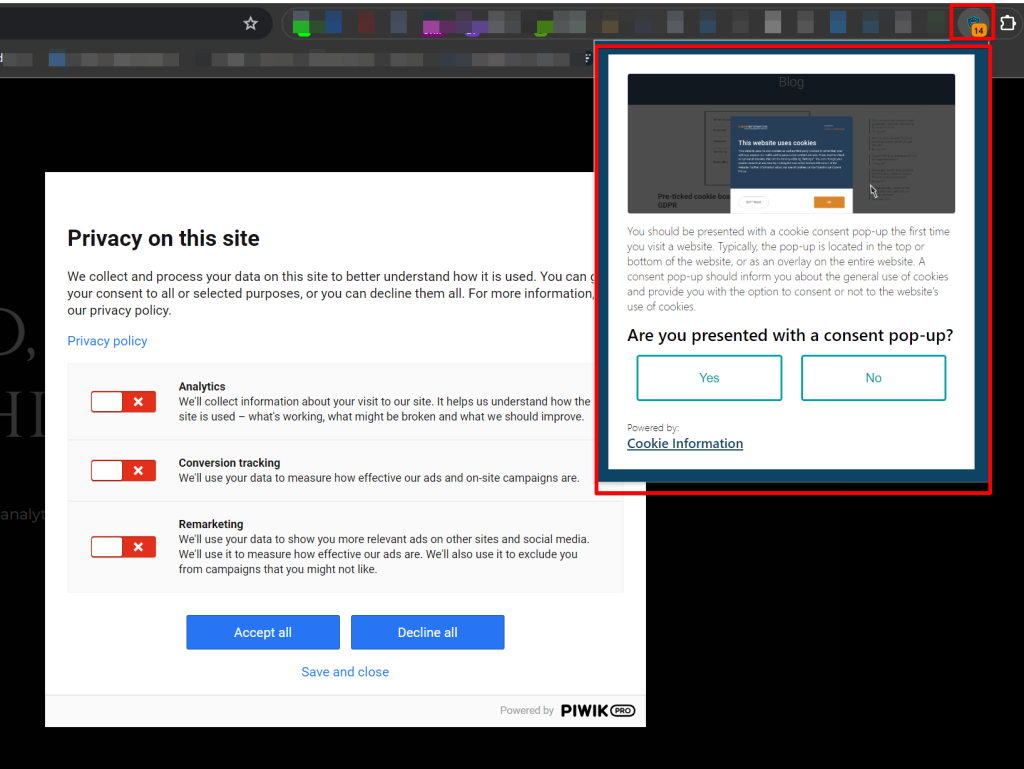
Upon completion of the audit, the tool allows you to download the results in PDF format, which you can share with your team for easy collaboration.
However, it’s critical to understand the limitations of this tool. The audit’s reliance on a single URL means it does not fully represent the compliance status of an entire website. For a more thorough compliance evaluation, I recommend utilising the cookie audit tools provided by your CMP provider, which can offer a comprehensive view of your site’s adherence to privacy regulations from the view of cookie usage.
DataLayer Checker
The DataLayer Checker is a Chrome browser extension accessible via the Chrome Web Store. Its primary aim is to better understand how the dataLayer executes on your website and the information the dataLayer pushes holds. This tool is handy for analysing the execution patterns of the dataLayer, including the structure and sequence of dataLayer pushes.
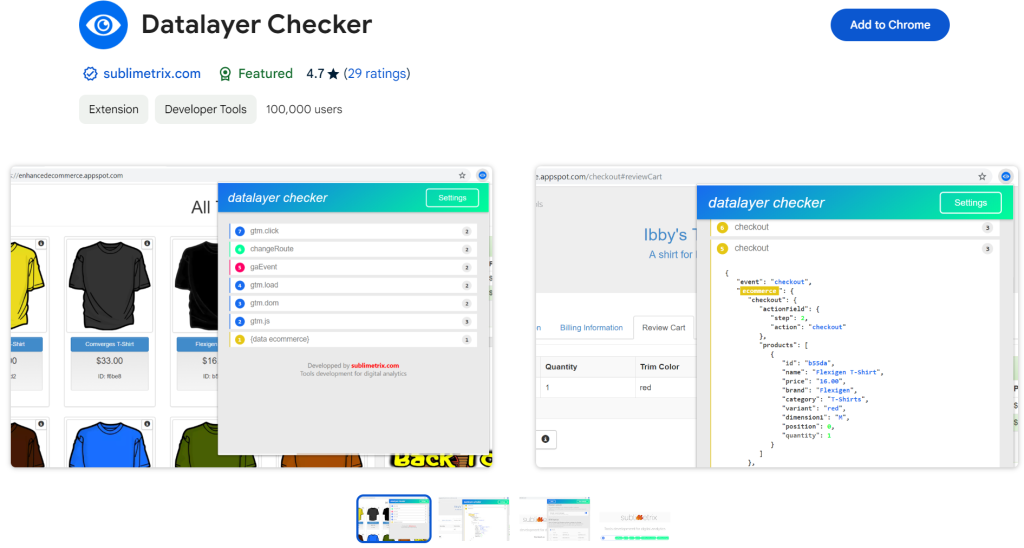
In debugging for consent mode implementation, you can see the values of the Google Consent Mode’s default and update commands. You can also use this tool to understand what dataLayer event pushes gets executed by your CMP vendor.
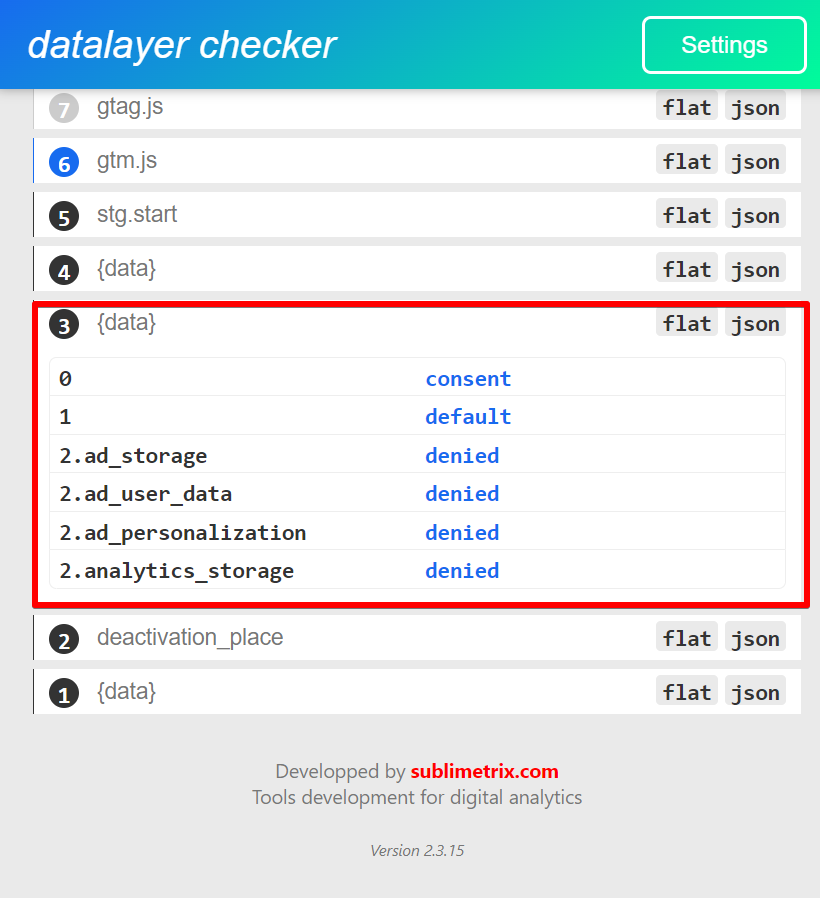
Furthermore, the DataLayer Checker enables users to monitor the frequency and hierarchy of these executions, providing insights into how data is structured and managed on your site.
Verified Data by Brian Clifton
While the main emphasis of this blog post has been on Google Consent Mode debugging tools, Verified Data by Brian Clifton warrants mention for its auditing capabilities and automated testing features, particularly concerning data collection compliance checks.
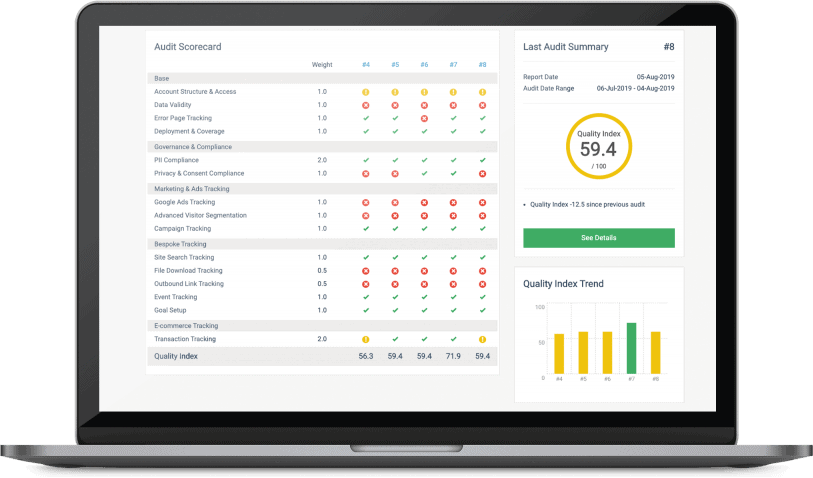
The tool owner is Brian Clifton, a distinguished data privacy expert. Verified Data offers a robust platform for ensuring that your data collection practices are efficient and compliant with relevant standards and regulations.
Browser Developer Tools
Browser Developer Tools are not exclusive to Google Chrome; they are available across all web browsers. To debug using these tools, you’ll primarily use the “Console” section to log Google Consent Mode configuration details. This feature allows you to track consent status updates and changes effectively.
The console is handy for those who prefer not to rely on browser extensions for monitoring Consent Mode command values.
By entering the global JavaScript variable “google_tag_data” in your browser, you gain access to information related to Google Tags present on the site, including data pertinent to Consent Mode.
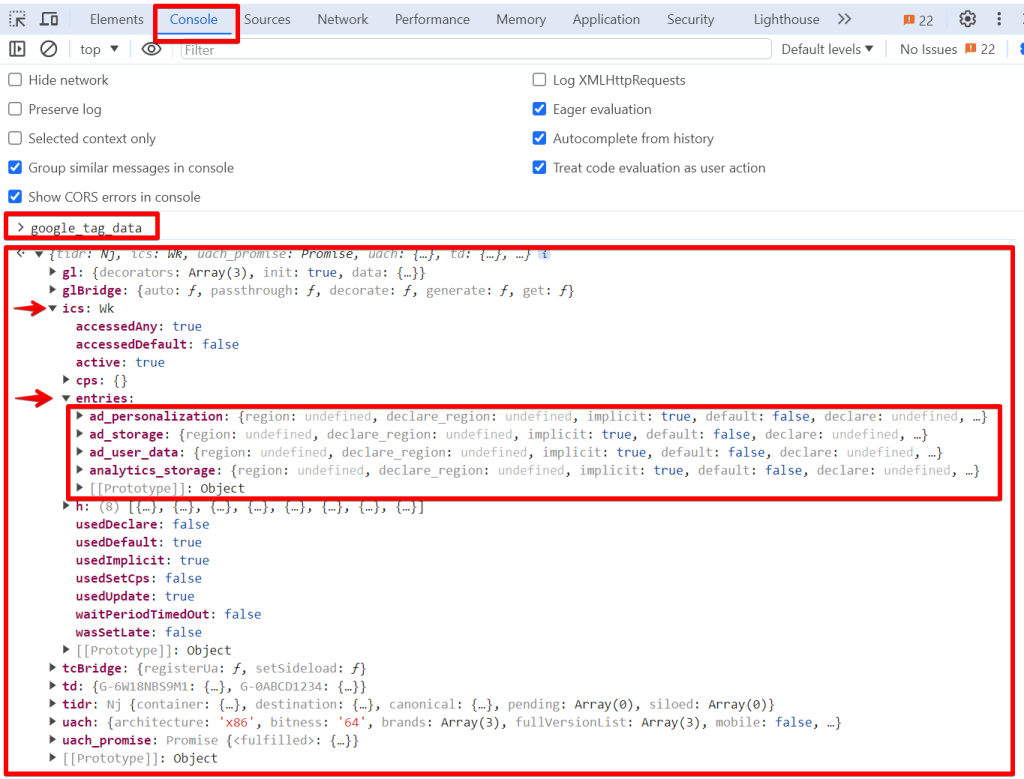
You can input “google_tag_data.ics.entries” into your browser to locate this data.
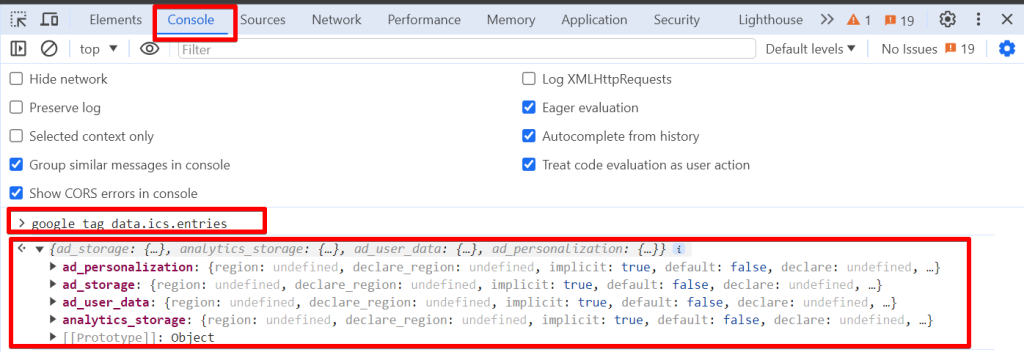
This action retrieves object data showcasing the consent storage types included in your Consent Mode implementation alongside the privacy settings allocated to each type.
This tool makes it possible for you to;
- Verify the presence of any missing consent storage types
- Assess whether you have successfully transitioned to Consent Mode v2,
- Check for the absence of a “default” status in your setup and identify any implementation errors.
Another valuable feature is the “Network” tab, which reveals the consent and privacy parameters included in your Google Tags hit requests.
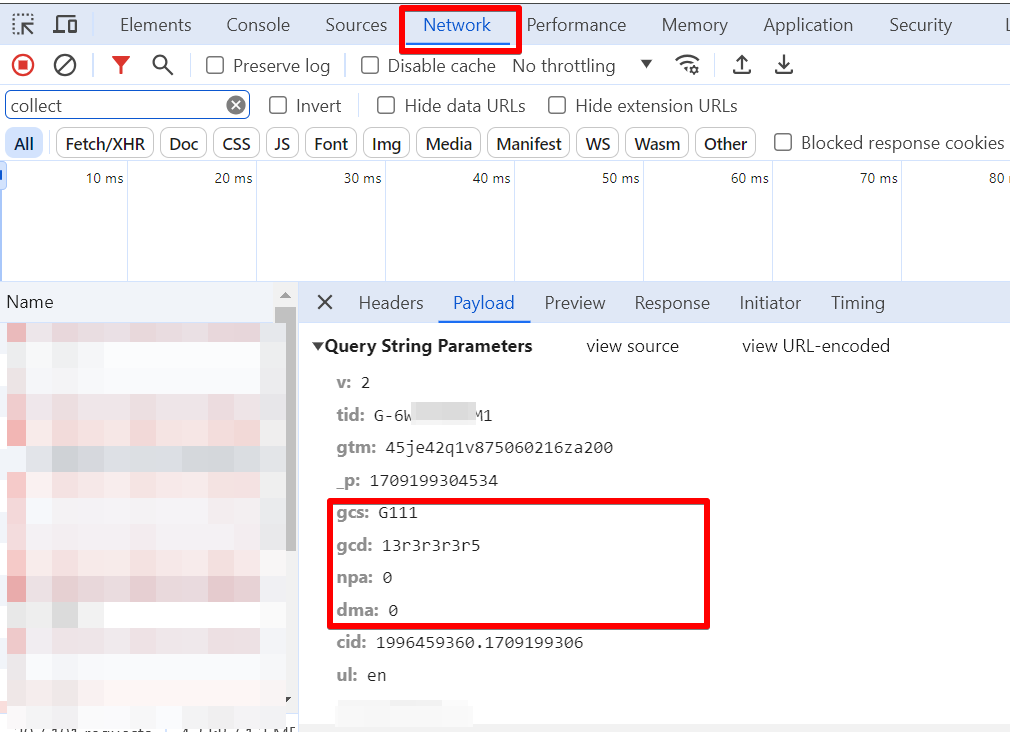
However, navigating the “Network” tab may present a challenge for those less familiar with these tools. Therefore, the alternative options discussed in this blog post could be more accessible solutions for debugging, testing, and auditing your Google Consent Mode implementation.
Concluding Thoughts
Privacy remains a pivotal element in our marketing strategies, and through this article, I have aimed to reacquaint you with the essentials of Google Consent Mode V2. Furthermore, I have introduced several tools designed to assist in debugging your Consent Mode implementations and assessing the compliance of your tracking mechanisms.
Always consult with your legal team before implementing any privacy-related measures to guarantee that you are not infringing upon user rights or violating any privacy regulations applicable to your business entity. You can also check out this CookieInformation article that answers ten (10) questions about Consent Mode v2 to see if any answers cater to your question.
Additionally, I will periodically update this blog post with new tools and insights to ensure you remain informed about the latest developments in Google Consent Mode debugging. Should you be aware of any tools not covered in this article, please notify me via LinkedIn.
I am eager to hear about your experiences with these Google Consent Mode debugging tools. Are you currently utilising any of them or considering their adoption for upcoming projects? Feel free to share your thoughts, preferences, and anything I missed or needs to be corrected through DumbData email or by connecting with me on LinkedIn. Until our next blog post, I wish you success in maintaining compliance and navigating the complexities of digital privacy.