


Real-time reporting can be incredibly beneficial in situations where we need immediate data to provide actionable insights and answer our marketing or business questions as the data gets collected.
However, it is not suitable for all use cases. Piwik Pro Analytics now supports acquiring real-time insights through its analytics suite’s “real-time dashboards” feature.
Although Piwik Pro previously supported real-time insights in different ways, I will also cover those methods in this blog post.
In 2023, the Piwik Pro team announced that they would release real-time dashboards in 2024. This feature allows users to receive real-time insights and reports as analytics data is collected (near real-time) in the Piwik Pro Analytics tool.
This development pushed me to write about the new feature and various ways to utilize it; the dashboard builds aspects of this feature, lesser-known things, instances where it might be necessary, and other real-time insights features in Piwik Pro, and how these features differ from Piwik Pro’s real-time dashboards, which provide data reporting in real-time.
What Is a Real-time Dashboard?
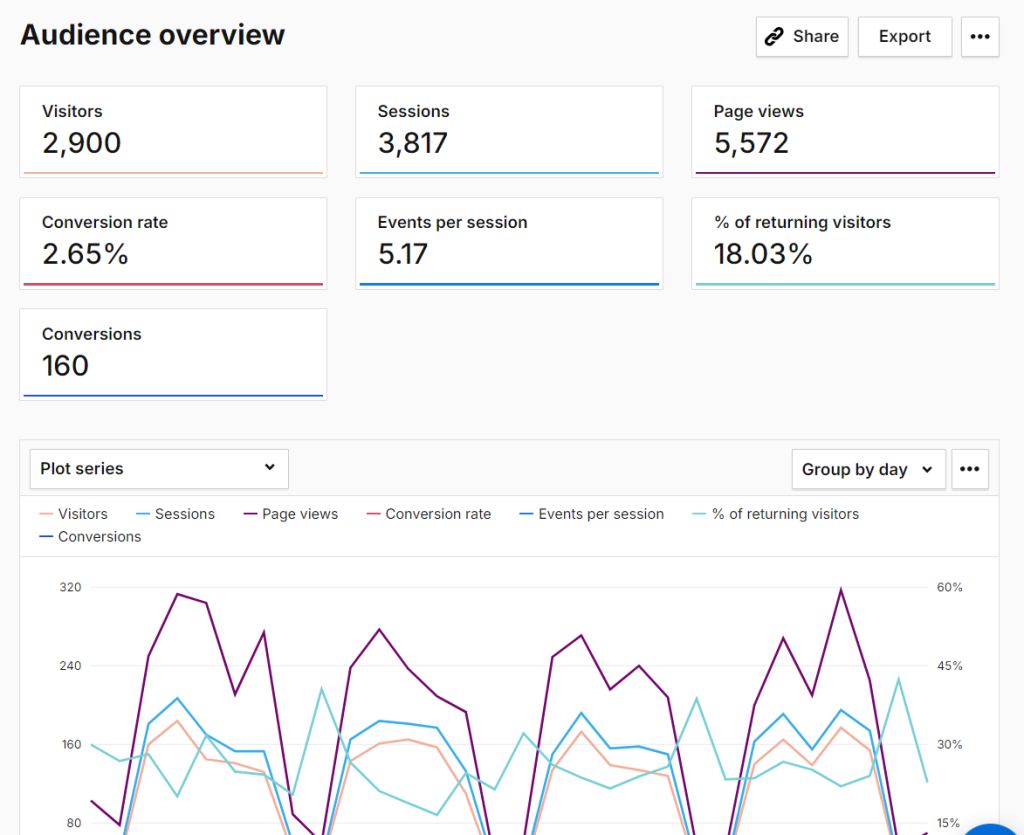
As the name suggests, a real-time dashboard is a dashboard you can easily consult for quick, real-time insights into data collected over a specific time range. This dashboard is continuously updated as data comes in, making it useful for reporting, investigating, and taking immediate action.
You might wonder, “Why use real-time reporting or a dashboard, and do I need it?” This question leads to the next section of this guide.
Do You Need the Piwik Pro Real-time Dashboard?
Not everyone may find value in real-time dashboards, insights, or reporting, but this doesn’t make real-time reporting useless. There are specific scenarios where your organization, client, or business might need such capabilities, and the Piwik Pro analytics real-time dashboard can provide real-time insights and reporting.
One key consideration is that if you are not using real-time data to take immediate action, make decisions, or confirm certain things in real-time, there is no need for a real-time dashboard.
Possible Use Cases for the Piwik Pro Real-time Dashboard
Publishing Websites: If you release content frequently and need real-time insights into visitor behaviour and content consumption trends for your premium and research-based content, the Piwik Pro real-time dashboard can help you understand these behaviours as they happen.
Post-Launch Monitoring: After a website launch, migration, or analytics implementation, a real-time dashboard can verify that data is being collected correctly in your Piwik Pro Analytics project and monitor for issues or anomalies.
PR Engagements: Following a business PR engagement or release, your team or stakeholders may need to understand the PR’s effects on website activity, such as acquisition, engagement, activation, and conversion, in real-time.
Make Stakeholders Happy: For whatever reason, stakeholders or clients may require real-time data in a personalized dashboard to answer business, sales, or marketing questions. A possible example is building a report showing how a marketing campaign activation is performing based on metrics that matter.
Trend Identification: You can use the Piwik Pro real-time dashboard to identify emerging trends and patterns in traffic to your website. For example, you could detect a surge in visits or conversions from a particular business region, traffic channel, etc.
Issue Validation and Monitoring: After a campaign or promotion launch, the real-time dashboard can help monitor measurement issues (e.g., UTMs, broken implementations, inconsistent setups), preventing broader data quality issues.
Error Tracking: Although not often discussed, you can build a real-time report of website errors, whether manually tracked or automatically measured by your analytics platform. This allows your engineering team to promptly track and address user experience and conversion issues.
The examples I’ve laid above should inspire you to explore the possibilities and not limit your use of this feature.
If you are familiar with Piwik Pro Analytics, you know it supports various real-time insight acquisition forms. You might wonder why you should use the Piwik Pro real-time dashboard when Piwik Pro has other real-time insights capabilities. This question leads to the subsequent discussion in this blog post.
Types of Piwik Pro Real-Time Insights in Its Analytics Suite
Piwik Pro Analytics supports various forms of real-time insights, each with its own limitations. It’s essential to be aware of these features within their analytics module:
Piwik Pro Tracker Debugger:
The “Piwik Pro Tracker Debugger” is primarily a debugging tool but can also provide real-time insights. This tool is helpful for scenarios where you want to verify if your tracking implementations or fixes are working as expected before pushing them live or if they’re working for your live visitors.
This feature can be found in the Piwik Pro “Settings” view by navigating to the “Tracker Debugger” tab under the “Personal Tools” category.
For a detailed guide on using this tool, refer to my extensive guide on “Piwik Pro Debugging,” which covers several tools for debugging your Piwik Pro Analytics data collection.
You can creatively use it to observe real-time actions users take on a specific page, displaying session log data. Although the experience isn’t intuitive and customization is limited to data filtering, it is helpful for debugging.
However, using it for other forms of real-time reporting or analysis becomes challenging because you lack control or the ability to customize the displayed data based on your needs or questions.
Piwik Pro Reporting HTTP API:
Another way Piwik Pro Analytics facilitates real-time insights is through the Piwik Pro reporting HTTP API. João Valente has provided an excellent guide on building a Piwik Pro real-time reporting dashboard using this API and Streamlit.
The detailed guide shows how the Piwik Pro reporting HTTP API can extract real-time insights from data collected in your Piwik Pro analytics property. Piwik Pro offers two endpoints for real-time data:
- Raw Data API: Provides events in near real-time.
- Query API: Provides reports in near real-time.
However, using these APIs requires technical knowledge and comes with maintenance costs.
In addition to these methods, Piwik Pro can process and report on data collected in near real-time, typically within 30 minutes. This is impressive compared to Google Analytics (GA4), which often requires using Google Big Query and Looker Studio to build a real-time dashboard for current data. I have written a step-by-step guide on “Real-Time Reporting in GA4 Using Big Query and Looker Studio.”
According to the Piwik Pro documentation, how it processes data can be broken down as follows:
- Data access: Available within 30 minutes to an hour after a visitor’s session ends.
- Data calculation: Reports are generated quickly from raw data for any date range and segments.
Essential Things to Know About Piwik Pro Real-time Dashboard
Before I discuss how to approach real-time reporting in Piwik Pro Analytics and how to build one, it’s essential to cover some technical aspects of the Piwik Pro real-time dashboard feature, as this will prevent issues with the dashboard.
- Data Coverage: Real-time dashboards show data from the past 5 to 60 minutes.
- Data Refresh: Typically, data is refreshed automatically every 10 to 30 seconds, though large data loads may cause slowdowns.
- Lookback Window: Based on server time recorded when the event hits the server.
- Web-log Analytics: Data collected from web-log analytics won’t appear on real-time dashboards.
- Mobile App Data: Delays longer than the chosen lookback window mean data won’t appear on real-time dashboards.
- Meta Sites: The Piwik Pro real-time dashboard feature is not yet supported in meta sites property.
- Report Differences & Discrepancies: Real-time dashboards may differ from other reports in your analytics due to the calculation and cleanup of data post-session.
- Dimension Limitations: Some dimensions are not available in real-time dashboards. If at least one of the unsupported dimensions is used in a segment, custom channel grouping, or calculated metric, it can’t be applied to the real-time dashboard.
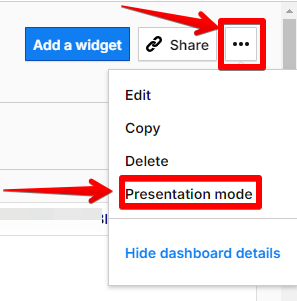
- Presentation Mode: Piwik Pro allows you to enable presentation mode to view real-time dashboards on a full screen, which I find valuable when you intend to display your dashboard on larger screens, such as a TV. This mode also prevents you from being logged out after 30 minutes of inactivity, displaying real-time data for up to 12 hours or until the tab is closed.
Now that you know how Piwik Pro supports real-time insights and some of the critical things about its real-time dashboard capability, let’s explore the process of building a real-time dashboard in Piwik Pro Analytics, including strategies and examples.
The Real-time Dashboard Building Process (Doing Your Homework Right)
Jumping straight into the “real-time dashboard” interface without a strategy might cause you to create something that your team, clients, or stakeholders won’t find valuable or use.
This section will provide a strategic approach to building a real-time dashboard that meets everyone’s needs and delivers the promised insights.
Determining & Defining Objectives, Needs & Requirements:
The first step is identifying who needs the real-time dashboard and why they need real-time reporting.
Doing this will help you understand the objectives and requirements of stakeholders, clients, or colleagues who will be using the dashboard.
During this stage, you should develop the business, marketing, engineering, or other relevant questions that need answering or aspects that require confirmation using the real-time insights the Piwik Pro real-time dashboard provides.
Defining What Real-time Means to Your Business:
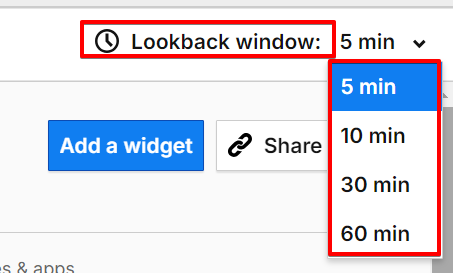
It’s crucial to define “real-time” for your business. Are you referring to data collected within 30 minutes, 10 minutes, or 1 hour? If you need data beyond 1 hour, the Piwik Pro real-time dashboard won’t be suitable. Piwik Pro allows flexibility in choosing your lookback window within ranges of 5 minutes, 10 minutes, 30 minutes, and 60 minutes.
Identifying and Documenting Metrics & Dimensions:
Using the dashboard needs or questions you’ve developed, create a list of dimensions or metrics to be used in your real-time dashboard. Ensure Piwik Pro’s real-time reporting features support these metrics and dimensions.
After listing the metrics and dimensions, verify if they support real-time reporting in Piwik Pro. Doing this will help prevent situations where you promise your clients or team something impossible.
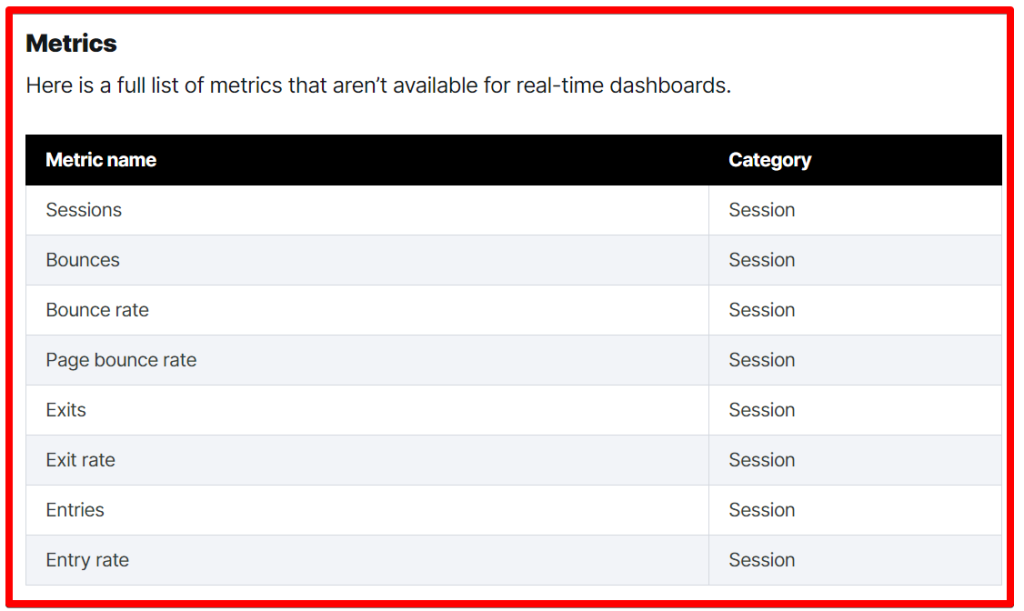
Here is a list of Piwik Pro metrics that aren’t supported in the real-time dashboards.
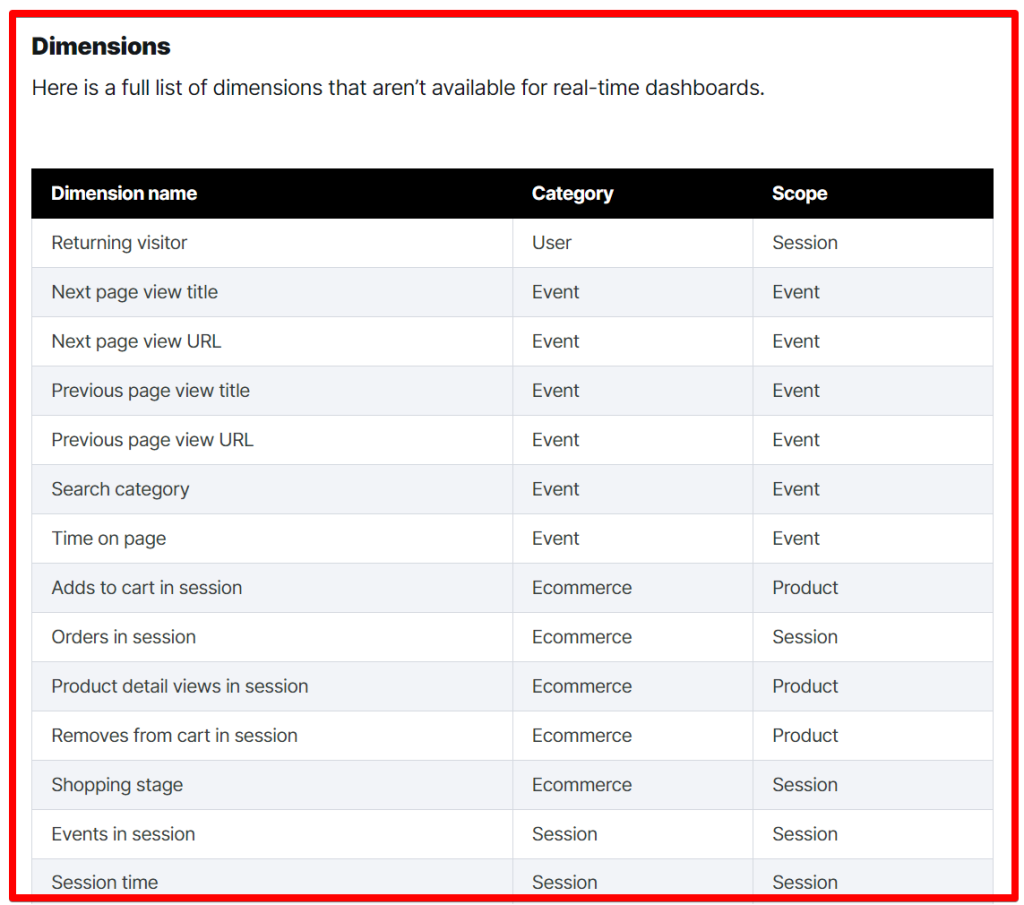
Here is a sample of the Piwik Pro dimensions that are not supported in the real-time dashboard. The complete list is available here.
Additionally, ensure that your custom calculations are correctly configured before using them in your dashboard to prevent providing inaccurate insights.
Avoiding Distraction Charts or Overload:
Focus on delivering valuable insights without overwhelming users with unnecessary charts or widgets. The goal is to help colleagues, clients, or stakeholders get the answers they need without distractions. Avoid adding charts or dashboard widgets that don’t contribute to insight value and instead act as distractions.
Quality Assurance (QA) and Announcement:
After building the real-time dashboard in Piwik Pro, please review it to ensure nothing is missed or unnecessary. Then, share the dashboard with stakeholders or clients to showcase your work and gather feedback.
Now that you know these strategic tips, let’s move into the build phase, which is easy and has the same experience as the Piwik Pro dashboard reporting environment.
How to Build Your Real-Time Dashboard in Piwik Pro
Creating a real-time dashboard in Piwik Pro is straightforward, much like using the dashboard features available in Piwik Pro’s reporting capabilities.
You can create multiple real-time dashboards in your Piwik Pro Analytics property for different purposes, use cases, and teams. This flexibility is one of the great features provided by the Piwik Pro team.
To create a real-time dashboard, follow these steps:
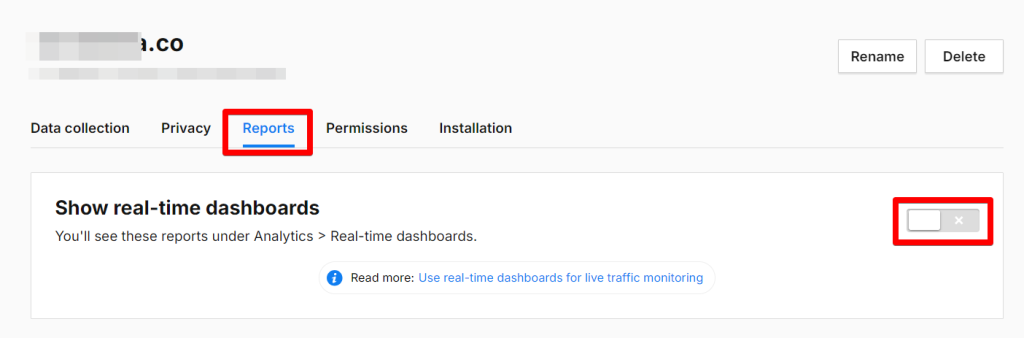
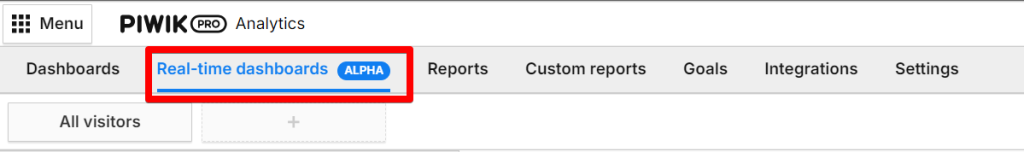
1. First, you’ll need to enable this feature for your analytics project if you can see the “real-time” tab in the analytics UI, as shown below.
Navigate to the “Admin” section of the Piwik Pro Analytics site, then go to the “Report” tab and enable it for your project. Doing this will activate the Piwik Pro “real-time dashboarding” capability for your website’s Piwik Pro Analytics project.
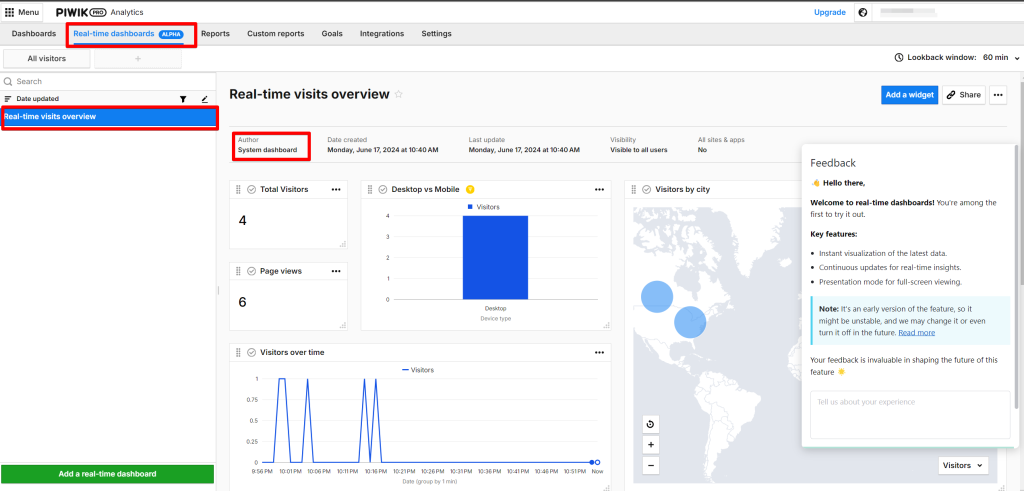
2. Click on the “Real-time dashboards” tab. This will open a view similar to the “Dashboards” interface.
You’ll also see an already-made template to help ease the use of the Piwik Pro real-time dashboard feature, which provides real-time insight.
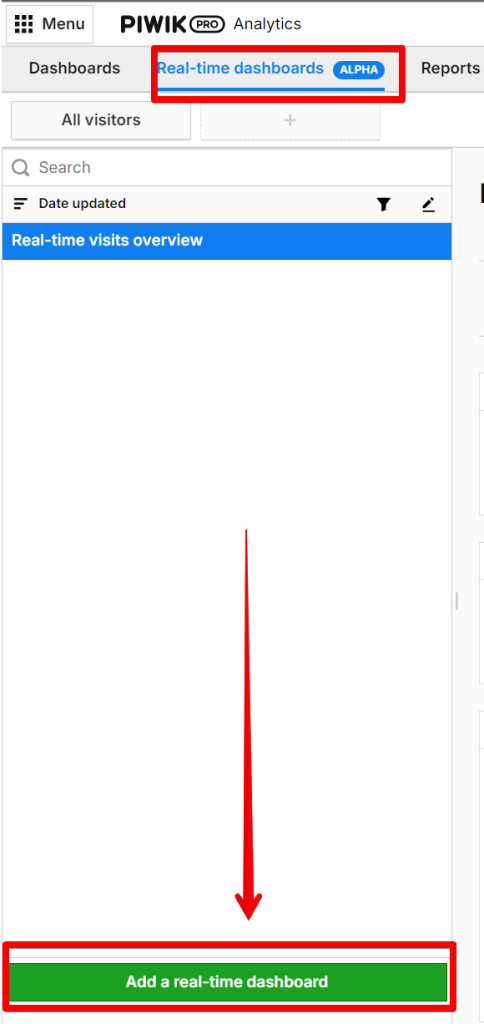
3. Click the “Add a real-time dashboard” button to start the creation process.
In the pop-up modal, you’ll be asked to input the real-time dashboard name. Make sure to choose a descriptive name and then select the “visibility” status. You have the following options:
- Author
- All users
Additionally, you can select whether to make it available in All Sites & Apps (which allows you to push what you’ve done across all Piwik Pro sites and apps). However, note that meta sites do not support the Piwik Pro real-time dashboard.
Choosing “Author” is recommended if you are the only one handling the build. You can select “All Users” when you’re ready to launch the dashboard or if more than one person is working on it.
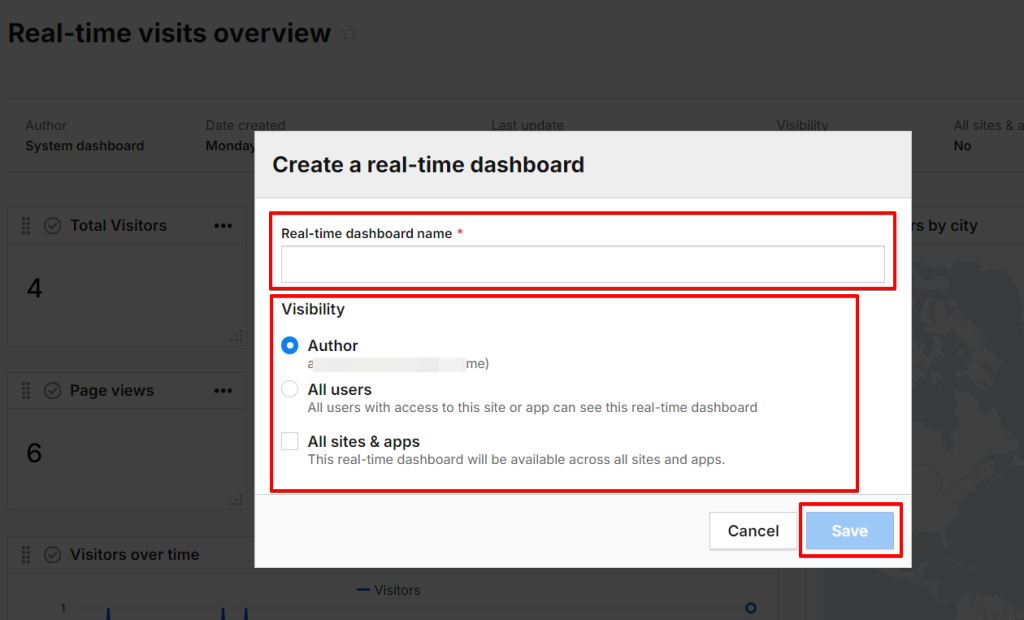
Once this stage is complete, click the “Save” button.
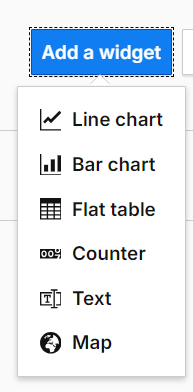
This will open a blank canvas where you can click the “Add a widget” button to select from the following options:
- Line chart
- Bar chart
- Flat Table
- Counter (similar to the scorecard in Looker Studio)
- Text
- Map
After adding a widget, you can configure it by selecting metrics or dimensions from the right-hand side and dragging and dropping the data into the widget configuration space.
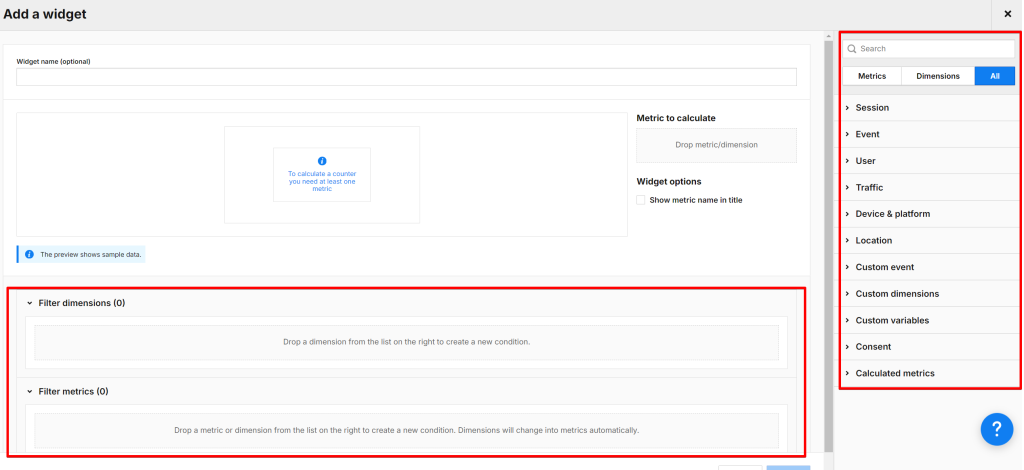
You can also apply metrics and dimension filters to the widget displaying data.
You can set default sorting options when using the “Flat Table” widget. This feature allows the data to appear in a specific order in the report based on the selected dimension or metric.
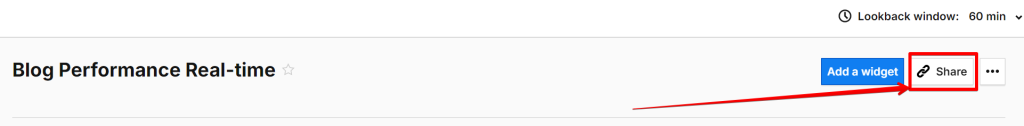
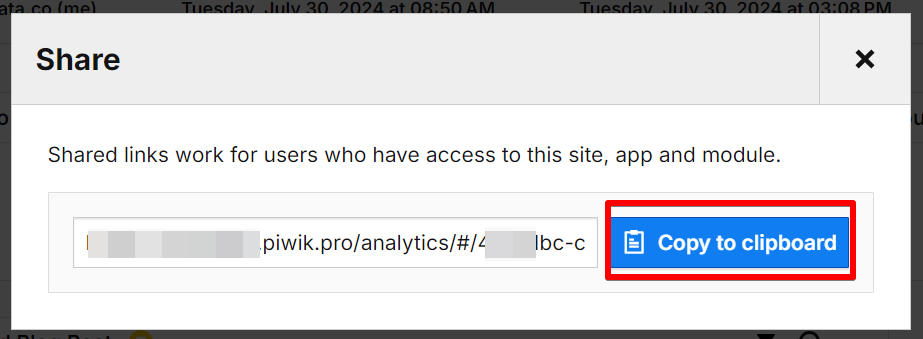
After you’ve created a real-time report in Piwik Pro Analytics, you can share it with individuals who have access to your analytics property by clicking the “Share” button.
Clicking the “Share” button provides you with the real-time report URL for easy access by other collaborators.
If the Piwik Pro real-time dashboard access is set to “Author,” a message will be displayed on your screen with an option to change the report access permission.
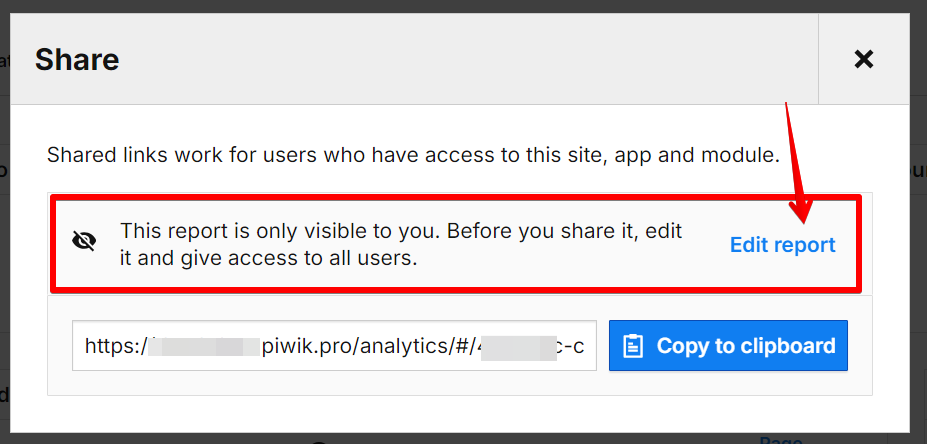
While real-time dashboards with “All Users” access permission display no message, only the report URL with the ability to copy it.
You can also set the Piwik Pro real-time dashboard to “presentation mode,” which provides a better viewing experience and prevents you from being logged out after 30 minutes of inactivity while on the real-time dashboard.
One of the flexible settings in this feature is the ability to select the lookback period in the Piwik Pro real-time dashboard. To do this, click the dropdown menu next to the “Lookback Window” option and choose from 5 minutes, 10 minutes, 30 minutes, or 60 minutes.
Each widget includes a drop-down menu where you can perform various actions. The “Show filter definition” option is particularly useful, as it allows you to quickly see what filters have been applied to the data displayed in that widget.
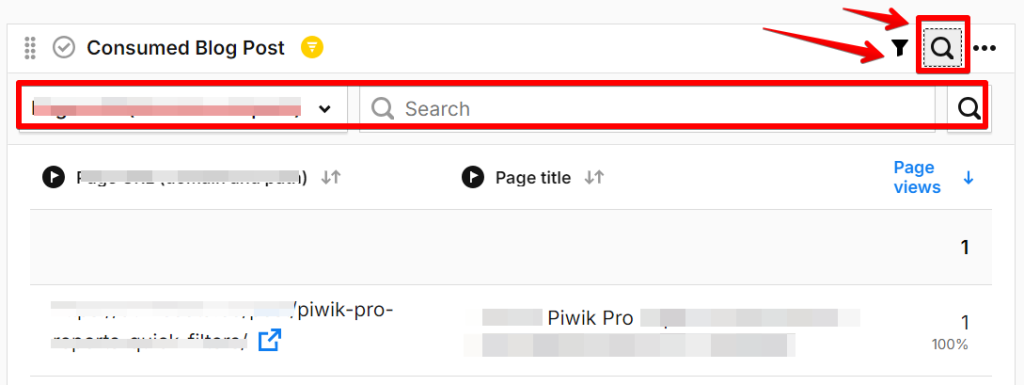
For the table widget, you can toggle and use the search option by clicking the search icon. Additionally, you can use the “Quick Filter” option, a feature I have covered in this guide.
Also, remember that you can use custom dimensions, calculated metrics (a feature I’ve written about in a blog post on advanced consent reporting in Piwik Pro), custom variables, and the Segment feature. However, it’s crucial to validate the calculated metrics, segments, or custom dimensions you use to ensure it’s error-free and keep in mind that if you include even one unsupported dimension in a segment, custom channel grouping, or calculated metric, it cannot be applied to the real-time dashboard.
Examples of Piwik Pro Real-Time Dashboards
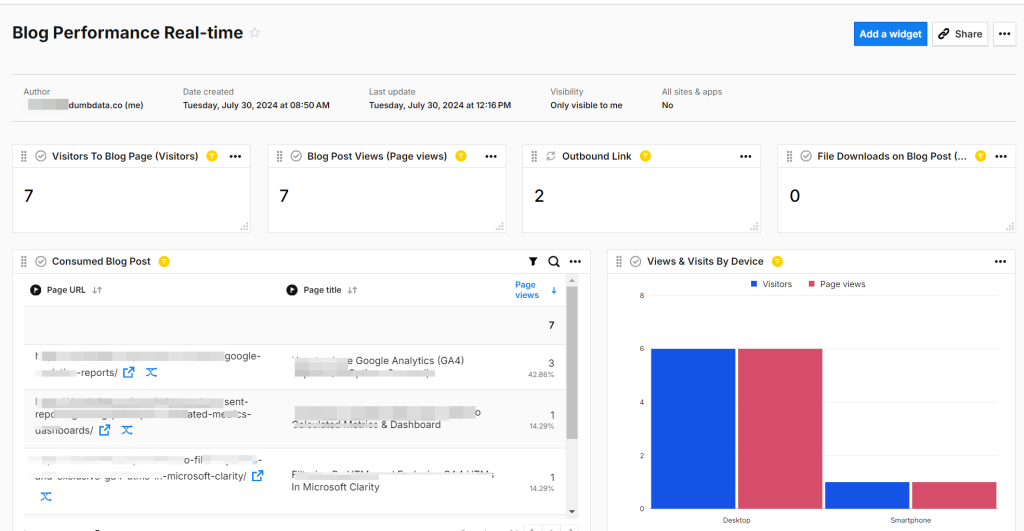
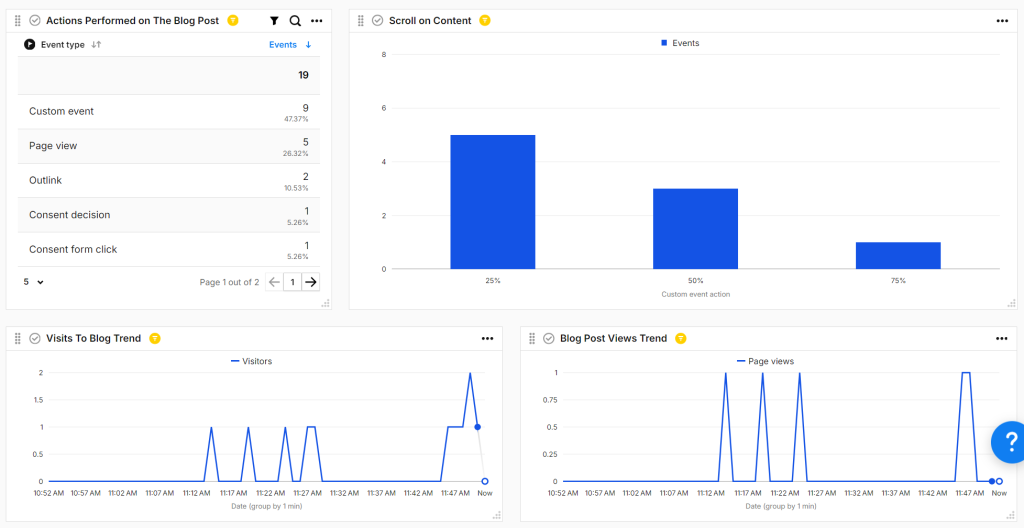
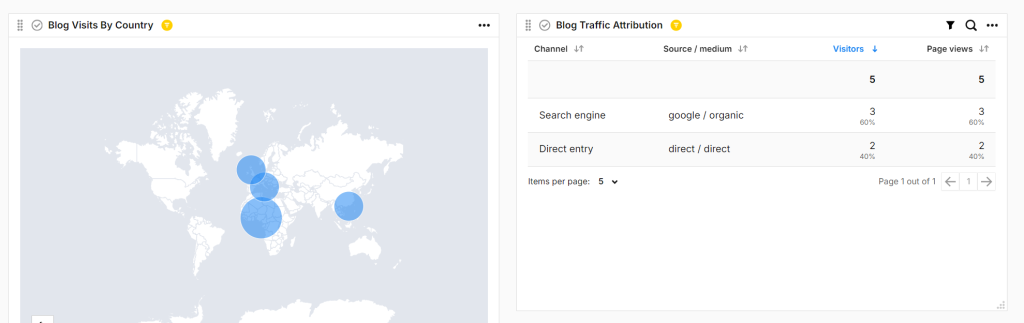
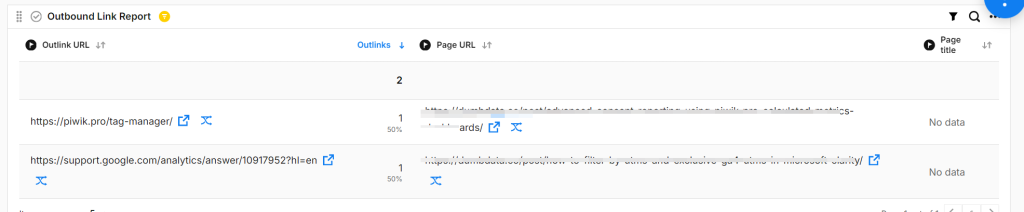
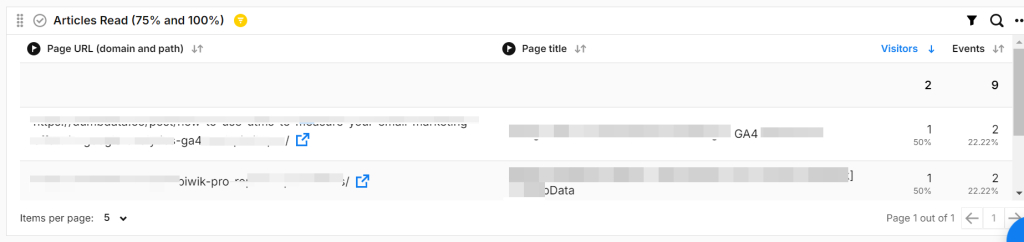
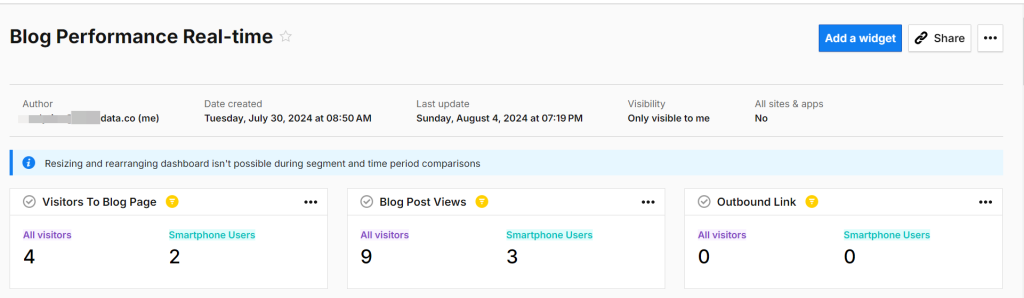
Real-Time Blog Content Performance Example:
This example demonstrates how your content team can measure content performance in real-time using the Piwik Pro real-time dashboard feature. Note that many filters were used to refine the data.
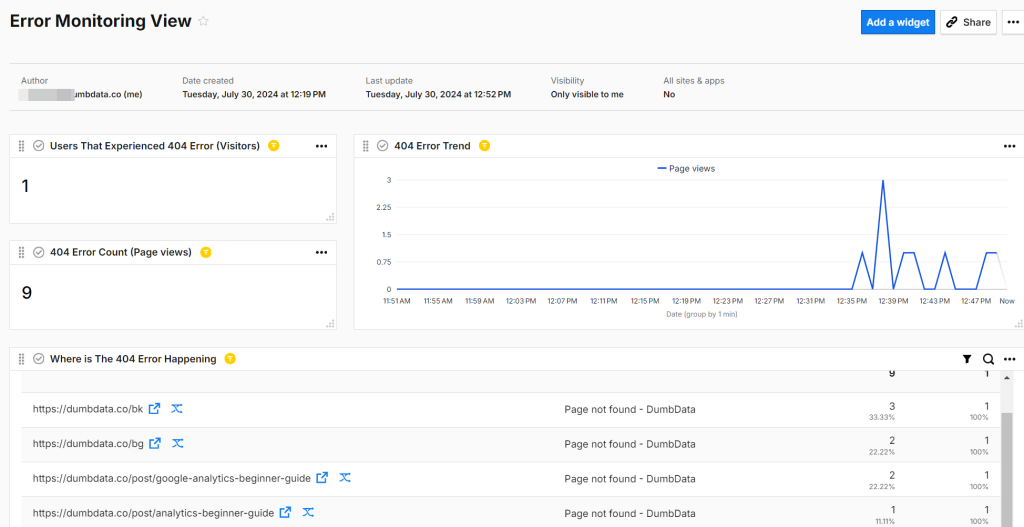
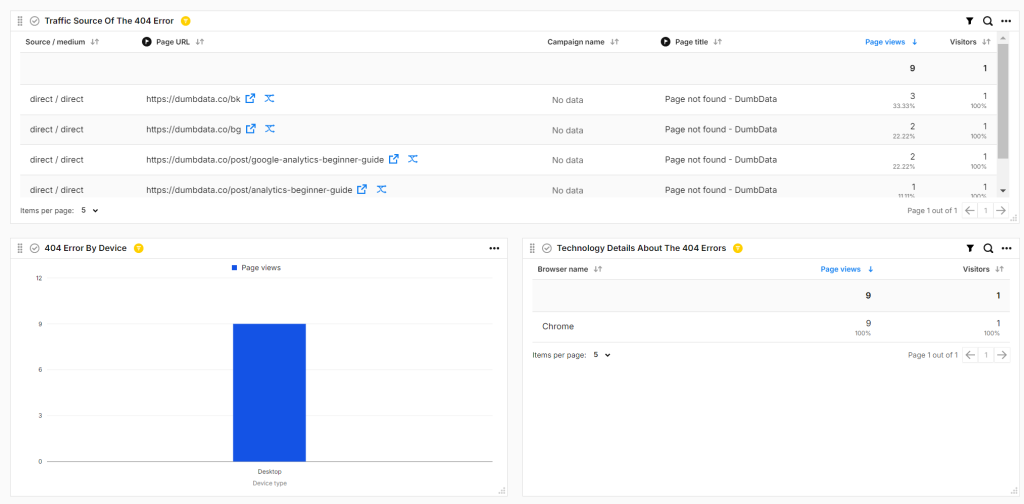
Error Monitoring in Real-Time
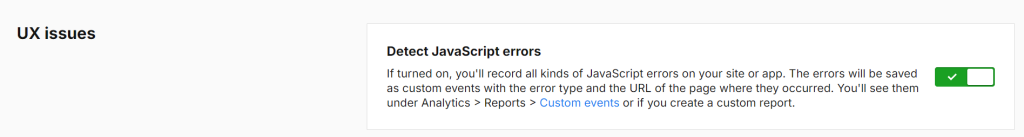
You can use Piwik Pro to monitor your website’s 404 errors and JavaScript errors in real-time. You can extend this to monitor other types of errors as well.
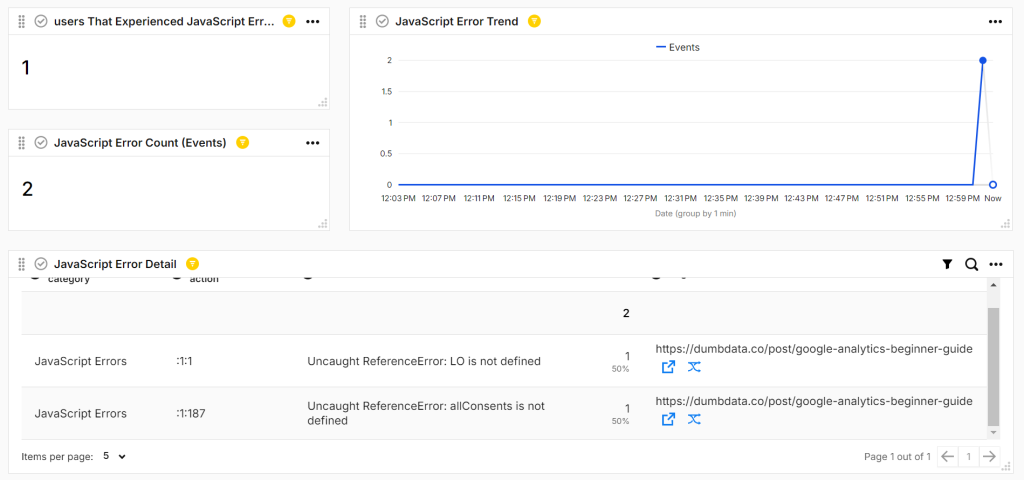
For JavaScript error tracking, ensure this Piwik Pro Analytics suite feature is enabled during configuration.
Additionally, you can use Piwik Pro Alerts to monitor 404 errors and other issues on your website proactively. However, as this feature is not available out of the box, you need to be innovative in how you approach it.
Piwik Pro real-time reports offer many possibilities. To illustrate their potential, I’ve covered two real-time dashboard use cases above. However, I’ll not showcase further examples.
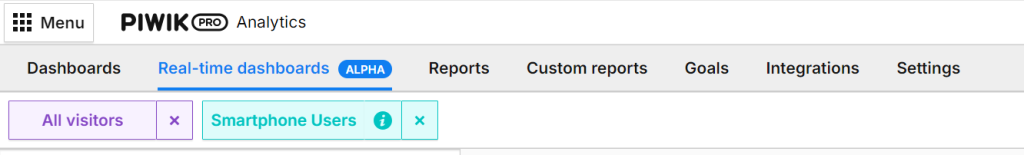
Data Segmentation in Piwik Pro Real-Time Dashboard:
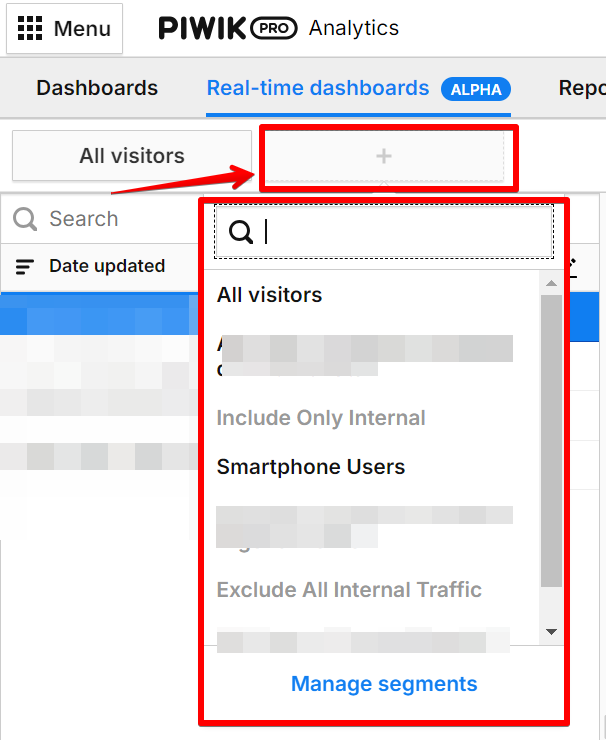
One of the great features of the Piwik Pro real-time dashboard is the ability to add segments to compare the performance of different website visitor segments. This is particularly useful for analyzing data for insights.
To add segments, click on the plus icon and select the segments you want to apply to your real-time dashboard.
After making your selection, the dashboard will update to show the differences between the segments.
However, note that if your segment includes an unsupported dimension, such as a session scope custom dimension, you won’t be able to use it. Piwik Pro will grey out the segment and display a message indicating that it cannot be used.
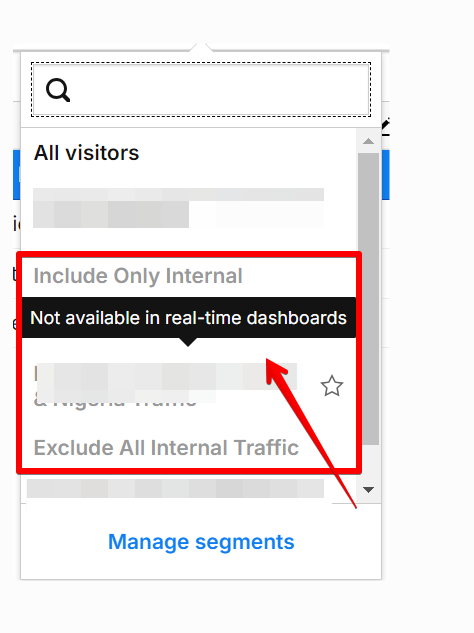
Additionally, keep in mind that you cannot use more than two data segments in your real-time dashboard.
Recap and Closing Thoughts
We’ve covered the essentials of real-time reporting, including the scenarios where this feature can be handy. We’ve also explored how Piwik Pro supports real-time insights beyond the real-time dashboard feature and how to create a custom real-time dashboard in Piwik Pro, including the high degree of customization flexibility.
Additionally, we discussed key considerations for effectively utilizing the Piwik Pro real-time dashboard. This includes strategic approaches to ensure you build a useful tool that addresses your organization’s or client’s needs, ensuring the dashboard gets used.
Now it’s your turn. Can you think of a use case for how you might use this Piwik Pro real-time dashboard for your business or clients? You can share that with me and if you have any questions or feel something was missed, feel free to reach out to me on LinkedIn or via the contact information on the DumbData Contact Us page.