


Getting real-time or yesterday’s and today’s data in the Google Analytics 4 (GA4) user interface is nearly impossible and a pain in the ass. In today’s article, we’ll explore how Looker Studio and BigQuery can help us recreate a real-time dashboard where you can get today’s data from conversion reports, demographic, etc.
I’ve wanted to write something on using Google BigQuery and Looker Studio for real-time reporting in Google Analytics 4. I’ve finally gotten an opportunity to write on this topic.
A quick disclaimer, I’m not an SQL guru, but I’ll be sharing links to some of the resources that can help you navigate the learning path to success.
QUICK NOTE: Find the link to part two of this article at the bottom.
What Is a Real-time Dashboard
A real-time dashboard works with data collected in real-time as they are received. It’s an interactive visual report that presents the latest data and automatically gets updated, with the sole purpose of monitoring data collection in real-time, tracking efficiency and identifying emerging patterns.
But why will you need a real-time dashboard?
Why Build a Real-time Analytics Dashboard (Especially for GA4)
I’ll take a step backwards to give you a sky scrapper view of the benefits of having a real-time report for monitoring data collection to your web analytics tool.
It’s important to remember that not all business needs a real-time dashboard.
An analytics specialist once said that a real-time dashboard needs real-time users to make real-time decisions.
Let’s start by briefly understanding some of the benefits of having a Google Analytics real-time dashboard before looking at some of the tool’s limitations.
- After a website launch or analytics implementation, a GA4 dashboard that reports data as they’re collected will be beneficial for monitoring things.
- With a real-time GA4 report, you’ll proactively identify and fix issues or leverage opportunities.
- It makes it possible to monitor business KPIs critical for business growth.
- It allows you to give stakeholders front-row tickets to GA4 real-time data rather than doing it from the wonky user interface.
- It’s an interactive medium for identifying emerging trends and patterns.
- You get access to update Google Analytics data.
If your business needs real-time reporting of Google Analytics data, here are some GA4 real-time reporting limitations that will push you to consider Google Big Query and Looker Studio to achieve this.
- Limitation in data availability in GA4 real-time report: You’ll only be able to see the last 30 minutes of data, which means it’s impossible to look at anything higher than this time range.
- Data Isn’t Always Fresh: There are several minutes of delay in what you’re looking at in the GA4 real-time report, and this is due to processing delays and latency issues.
- Branding Isn’t An Option: This is not exclusive to GA4. Like every other web analytics tool in the real-time report, you don’t have control over the look and feel of this report as they exist in the GA4 interface. However, it is shareable using the report link.
Here is what the GA4 real-time report looks like
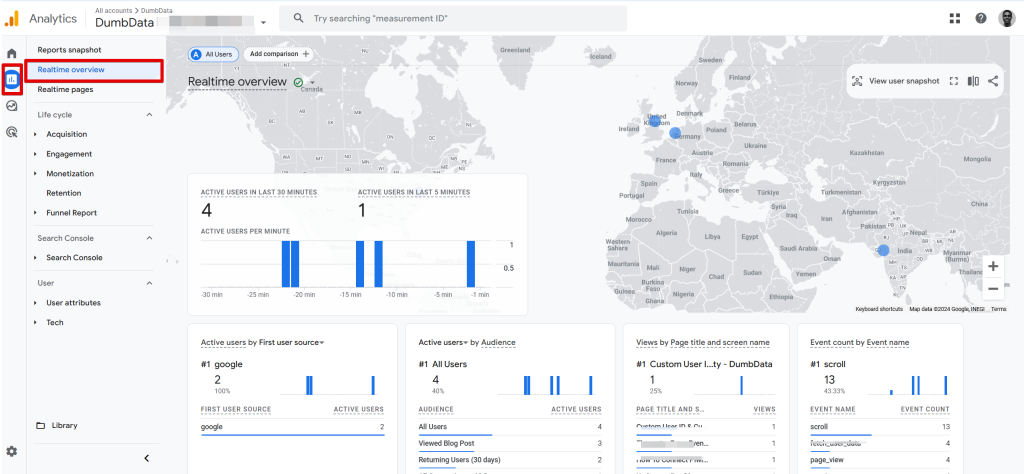
Navigate to the standard “Report” section, where you’ll find the “RealTime Overview” report. This report provides live data collection insights as they occur.
You can view:
- The number of active users in the past 30 minutes and 5 minutes.
- Traffic attribution details.
- Audience categories users have joined.
- Pages visited and event actions performed.
- User property labels associated with the users.
- Key events tracked during the session.
However, it’s important to note that the reporting interface may not be as intuitive as expected.
In addition to this, Google Analytics 4 (GA4) offers another real-time report called “Realtime Pages”, located just below the “Realtime Overview” report.
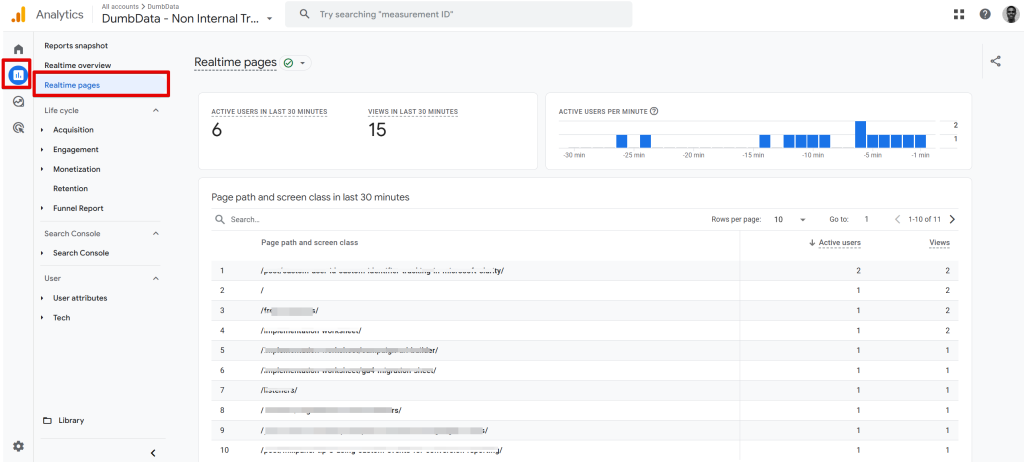
This report provides:
- The number of active users and page views in the last 30 minutes.
- A breakdown of page paths (URLs) with their corresponding active users and views during this timeframe.
It also includes a search functionality, allowing you to quickly locate specific pages by their path and gain real-time insights into their active users and views.
Note: If you don’t have the following Google Analytics 4 configurations, it’s impossible to apply the approach explained below, and these are;
- At least one of the data streams in your GA4 property needs to be in sync with BigQuery.
- Streaming needs to be enabled in your GA4 and BigQuery Link
This article doesn’t explain the linking process, but we have a FREE worksheet to help you. (Find the worksheet here)
Planning Like The Fed Does (The SQL Query + Dashboard Design)
Planning and strategy are essential for every project, whether launching a marketing campaign or doing analytics instrumentation; it’s a necessary recipe for success.
Planning:
We’ll start by understanding who will be using the report, their reporting needs, what data needs to be in the real-time dashboard, and if the dimensions/metrics are available to us in the GA4 and Big Query “intra_day” table.
You’ll also need to plan your dashboard, the structure, charts and report visuals.
Strategy:
In this part of the process, you’ll be mapping out your SQL query and what it should be to achieve our needs.
Determine what querying techniques you’ll be using to ensure cost efficiency and reporting accuracy.
Additionally, you’ll need a solid strategy for connecting your BiqQuery table to your Looker Studio dashboard and visualising it.
In our scenario, in the planning phase, I was able to identify my dashboard needs, the metrics and dimensions needed for building the GA4 real-time dashboard in Looker Studio, and these are;
Dimensions
- Event Date
- Event Date Time
- Hour
- Minutes
- User Type
- Event Name
- Event Parameters
- Page URL
- Cleaned Page URL
- Page Path
- Device Category
- Hostname
- Browser
- Country
- Region/State
- City
- Stream_id
- Platform
Metrics
- Users
- Sessions
- Event Count
Now let’s move to the phase of building the
Writing The SQL Query In BQ (Plus The Query Anatomy)
We’ll be using two different SQL queries to do this. The first query generates a table with all the above dimensions and metrics except the event parameters. And we’ll use Looker Studio to calculate the number of Sessions and users.
The second query outcome is a list of unique events and parameters and their data types.
Below is the first query, where we’ll pull all metrics and dimensions for our Google Analytics real-time dashboard in Looker Studio, except for event parameters.
SELECT
PARSE_DATE('%Y%m%d', event_date) as mainevent_date,
event_timestamp,
EXTRACT(DATETIME FROM TIMESTAMP_MICROS(event_timestamp) AT TIME ZONE "Africa/Lagos") as date_time,
EXTRACT(HOUR FROM TIMESTAMP_MICROS(event_timestamp) AT TIME ZONE "Africa/Lagos") as date_time_hour,
EXTRACT(MINUTE FROM TIMESTAMP_MICROS(event_timestamp) AT TIME ZONE "Africa/Lagos") as date_time_minute,
CASE EXTRACT(DATE FROM TIMESTAMP_MICROS(user_first_touch_timestamp) AT TIME ZONE "Africa/Lagos")
WHEN CURRENT_DATE("Africa/Lagos") THEN "New User"
ELSE "Returning User"
END as user_type,
event_name,
(SELECT value.string_value FROM UNNEST(event_params) WHERE KEY = "page_location") as page_url,
REGEXP_REPLACE((SELECT value.string_value FROM UNNEST(event_params) WHERE KEY = "page_location"), r'\?.*', '') as cleaned_page_url,
REGEXP_REPLACE(REGEXP_REPLACE((SELECT value.string_value FROM UNNEST(event_params) WHERE KEY = "page_location"), CONCAT(LOWER('https://'), LOWER(device.web_info.hostname)), ''), r'\?.*', '') as page_path,
user_pseudo_id,
CONCAT((SELECT value.int_value FROM UNNEST(event_params) WHERE KEY = "ga_session_id"), user_pseudo_id) as sessionId,
device.category,
device.web_info.hostname,
device.web_info.browser,
geo.country,
geo.region,
geo.city,
stream_id,
platform,
count (event_name) as event_count
FROM `sampledata-gcp-project.analytics_316084442.events_intraday_*`
WHERE PARSE_DATE('%Y%m%d',event_date) = CURRENT_DATE("Africa/Lagos")
GROUP BY
mainevent_date,
event_timestamp,
date_time,
date_time_minute,
date_time_hour,
user_type,
event_name,
page_url,
cleaned_page_url,
page_path,
user_pseudo_id,
sessionId,
device.category,
device.web_info.hostname,
device.web_info.browser,
geo.country,
geo.region,
geo.city,
stream_id,
platform
ORDER BY date_time_hour DESC, date_time DESC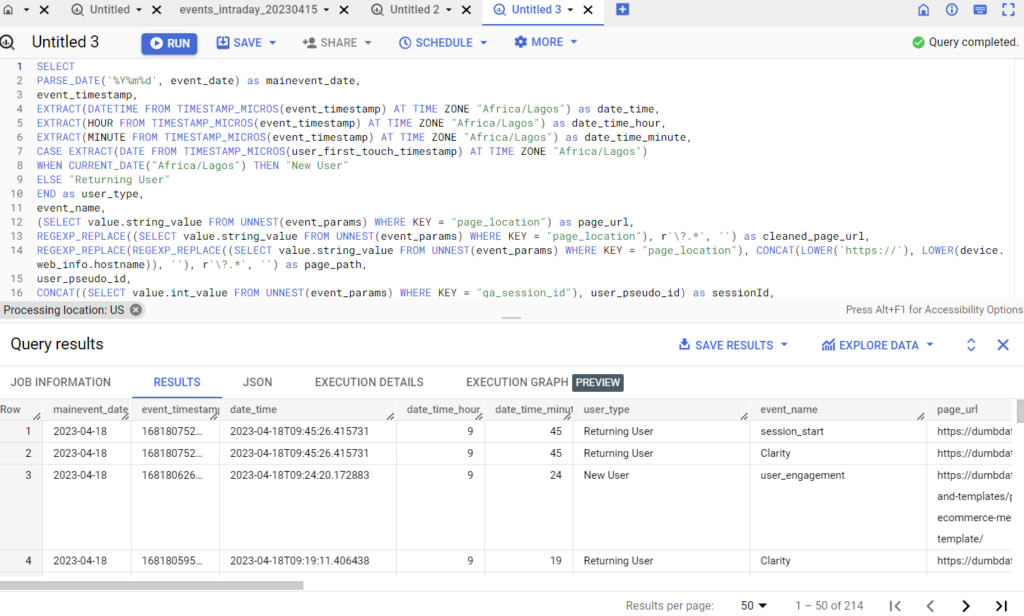
Note: You’ll have to update the following;
- timezones used in the query
- table name
Below is the second SQL query I found on Johan Van De Werken’s blog “ga4bigquery.com”, inspired by Robert Sahlin. I modified the code to only pull for today’s data and to include the session id used in building the debug view of the real-time Looker Studio dashboard.
select
    event_date,
    event_name,
    event_timestamp,
    user_pseudo_id,
    CONCAT((SELECT value.int_value FROM UNNEST(event_params) WHERE KEY = "ga_session_id"), user_pseudo_id) as sessionId,
    -- count (event_name) as number_of_times_included,
    params.key as event_parameter_key,
    case when params.value.string_value is not null then 'string'
        when params.value.int_value is not null then 'int'
        when params.value.double_value is not null then 'double'
        when params.value.float_value is not null then 'float'
        else null end as event_parameter_value
from
    -- change this to your google analytics 4 export location in bigquery
    `sampledata-gcp-project.analytics_316144442.events_intraday_*`,
    unnest(event_params) as params
WHERE PARSE_DATE('%Y%m%d',event_date) = CURRENT_DATE("Africa/Lagos")
group by
    event_date,
    event_name,
    event_timestamp,
    event_parameter_key,
    user_pseudo_id,
    sessionID,
    event_parameter_value
order by
    event_name,
    event_parameter_key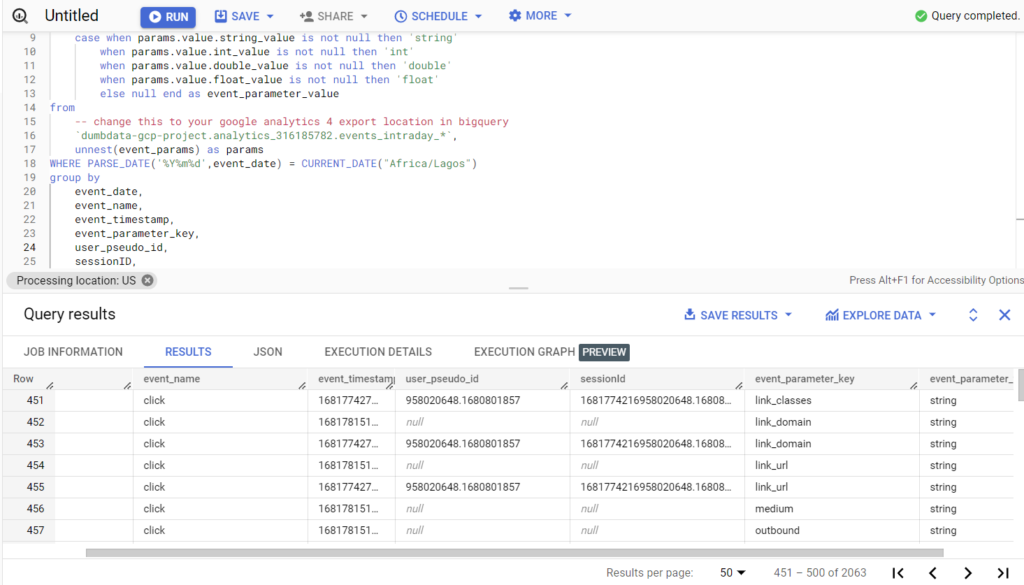
Note: you’ll have to substitute the current table name with yours.
As part of our strategy to recreate our real-time dashboard, the following paragraph is essential for our project’s success.
After you’ve created both queries in your SQL workspace, you’ll have to save them as a view because we need the Looker Studio dashboard to be automatically updated as the data gets streamed in Big Query.
Views In BigQuery
Several view types exist in BQ, and we will use the standard view type for our project.
To create them, follow these steps:
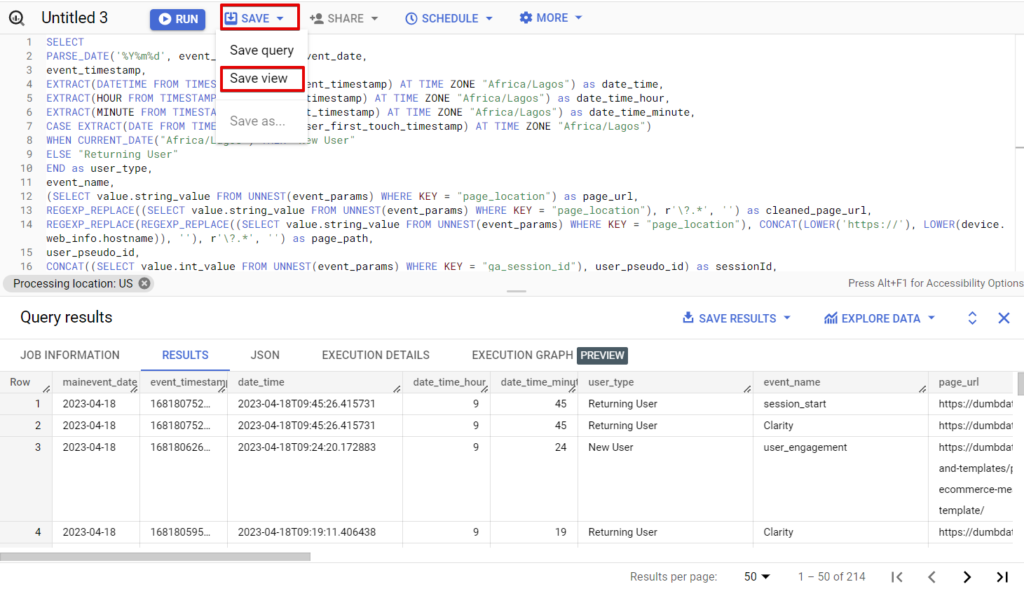
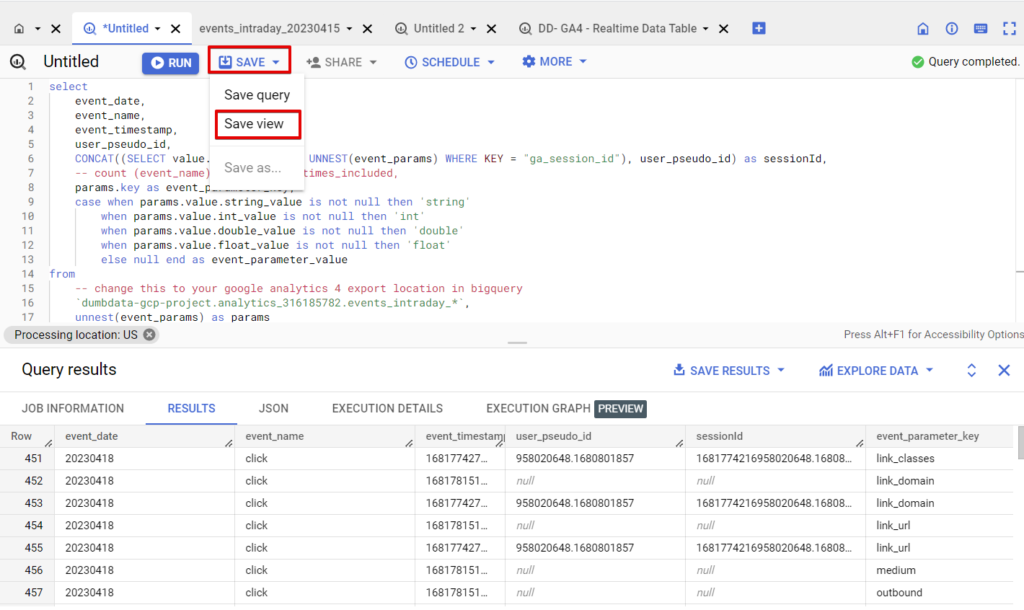
- Execute the query in the SQL workspace, which we’ve done.
- Click on the “Save” button and select “Save View.”
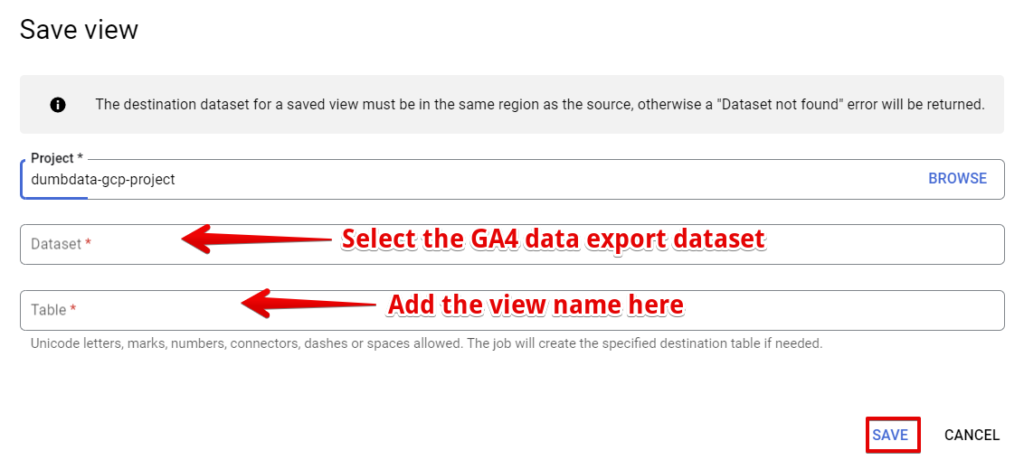
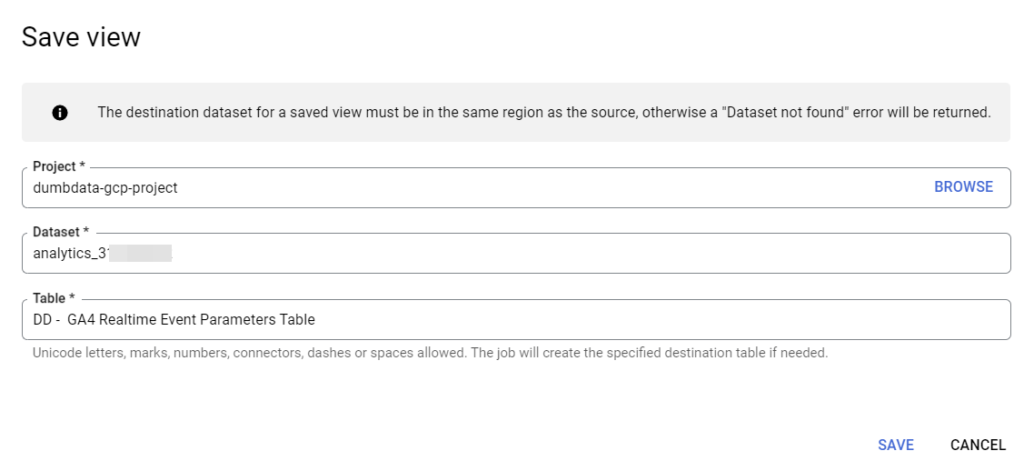
- Choose your GCP project.
- Select your GA4 Big Query data export dataset.
- Enter a descriptive table name, then click the “Save” button.
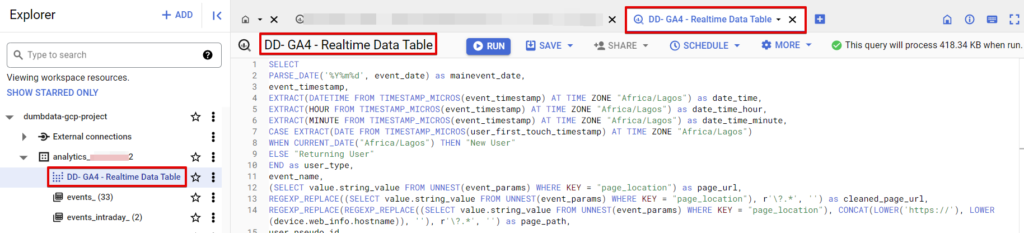
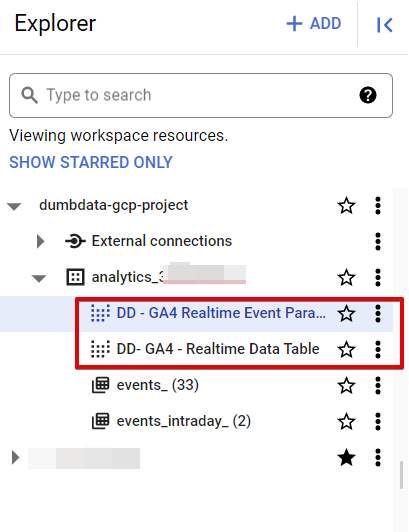
The view should now appear under your GA4 export data set.
Note: You’ll have to create two views for the first query and the second for the other.
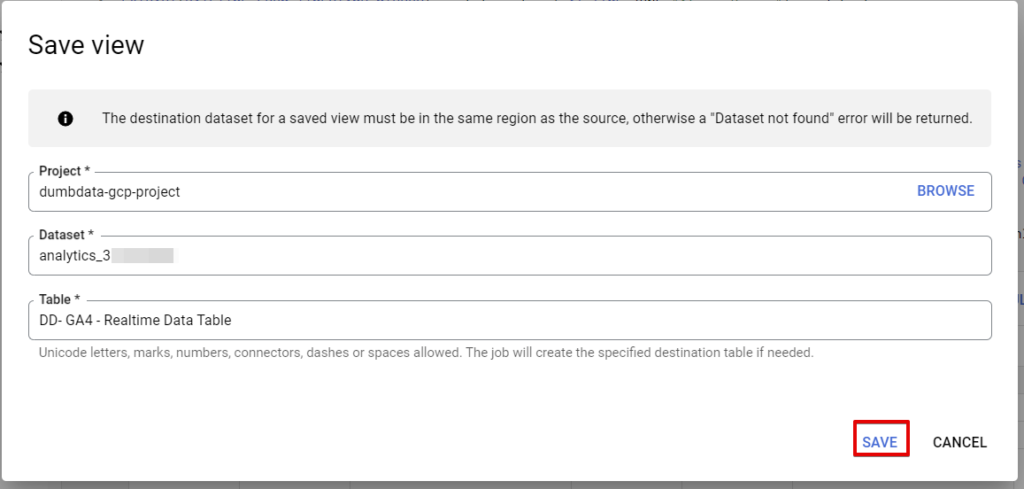
In this screen, select the project and data set. Lastly, add the view name before hitting the “save” button.
Here is what a view looks like in the BigQuery workspace. It has a unique icon different from standard tables.
Connecting The GA4 Real-time Big Query Data Tables To Looker Studio
Bringing the two data tables to Looker Studio is the real deal, and we can connect our Big Query view using the native Big Query connector in Looker Studio.
In Looker Studio, create a new report, add a data source and select “Big Query” as the connector.
Select your GCP project, the corresponding “Dataset”, and the view you created in Big Query “GA4_Realtime_Project”.
Follow the same approach to add the event parameter view we created earlier, “GA4_Event_Parameter”.
After completing this, let’s move to one last Looker Studio configuration before building the dashboard.
Real-time Syncing of GA4 Big Query Tables and Looker Studio Charts.
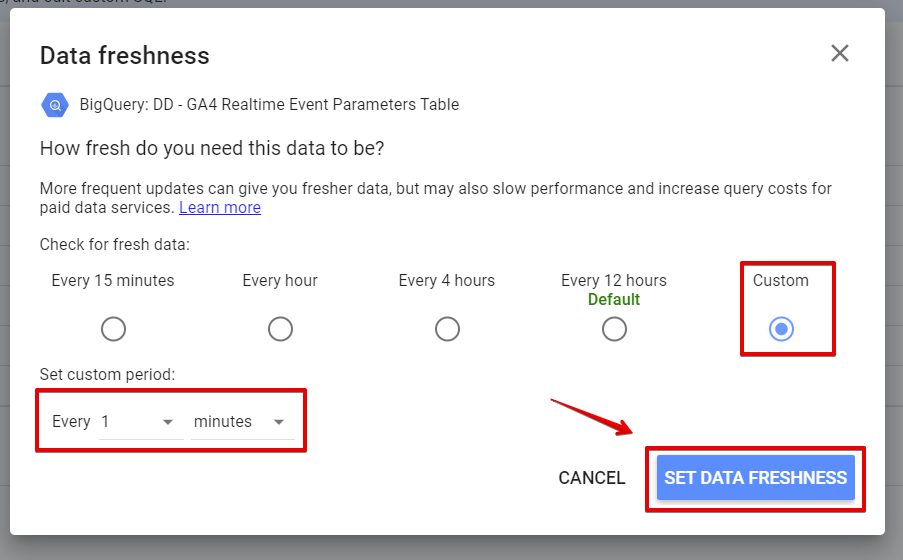
To ensure the charts aren’t using cached data, we’ll have to update the data freshness settings to show data as it’s collected in Google Big Query.
We’ll set the data freshness to 1 minute. Follow these easy steps to get this done.
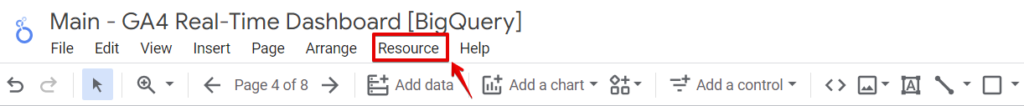
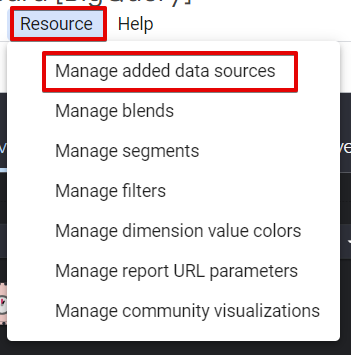
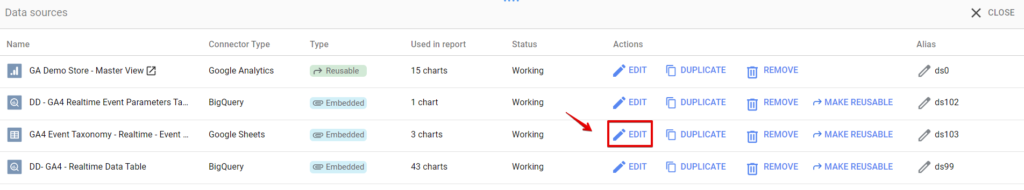
Click the “Resource” navigation menu and select “Manage added data sources”.
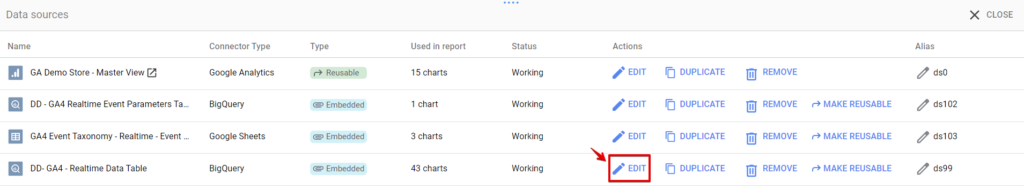
In the next screen, click the edit icon of the GA4 real-time data source.
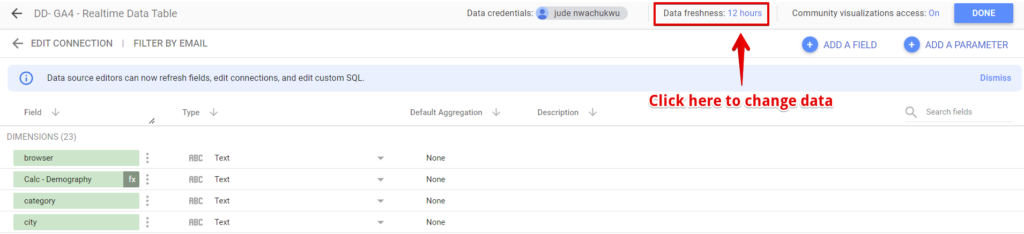
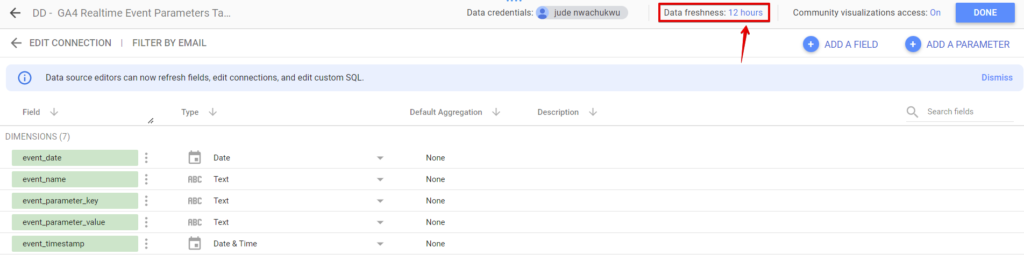
In the data source connection, click the blue number of hours in the data freshness connection settings, and you can change the time range.
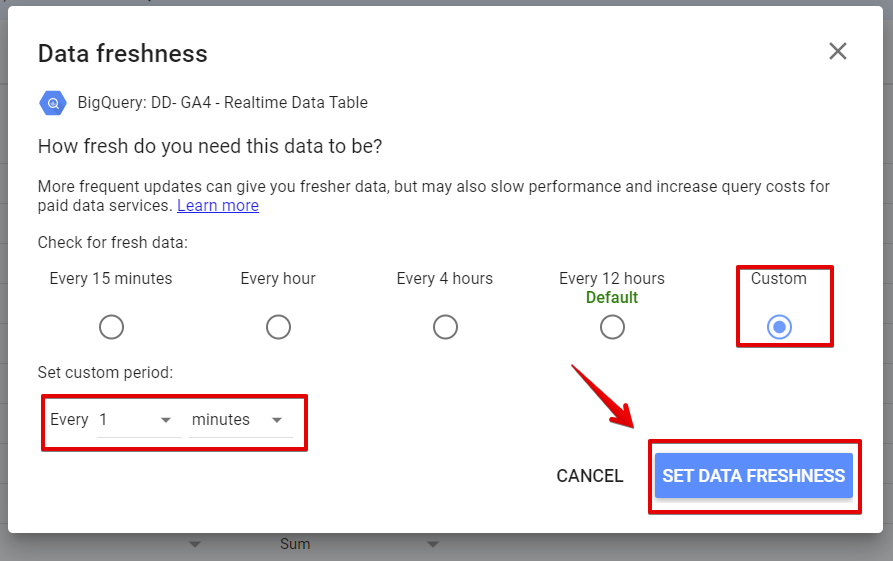
Select custom, set it to “1 Minute “, and click the “Set Data Freshness” button to save your configurations.
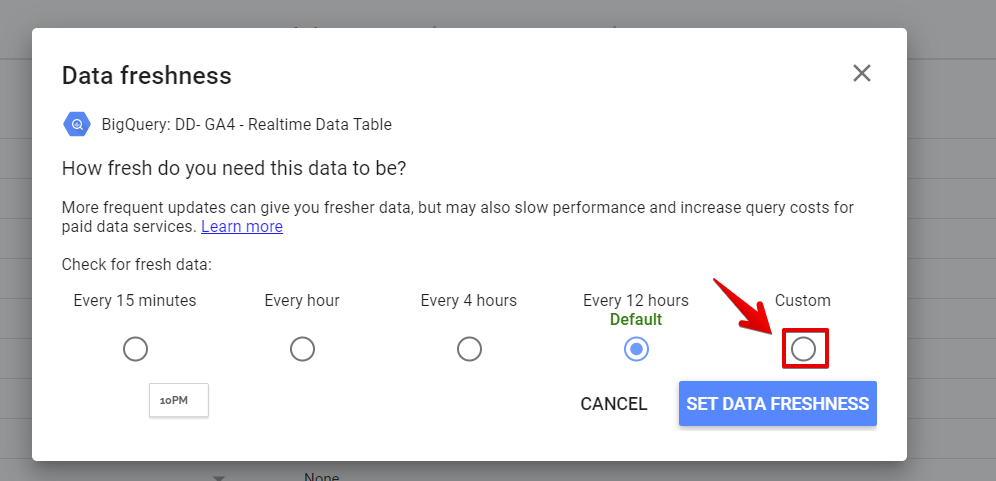
Set the data freshness to “1 Minute“, as that’s the lowest it can be
Repeat the same steps above for your GA4 event parameter data table that we connected to Looker Studio.
Click the edit icon for the event parameter table
Click the blue freshness time duration, which is “12 hours”.
Select “Custom” data freshness configuration
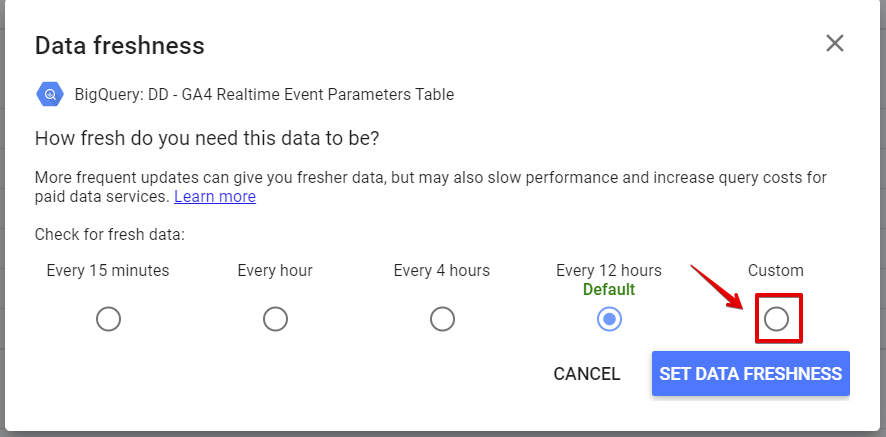
Set the data freshness for the GA4 event parameter table to “1 Minute”.
The Build In The Sexy Looker Studio
To avoid having a long to-read article, I’ll go over the dashboard building detail in part two of the article.
I’ll discuss the building and data blending process, using videos, images and text to show visual elements’ alignment, styling and creation process.
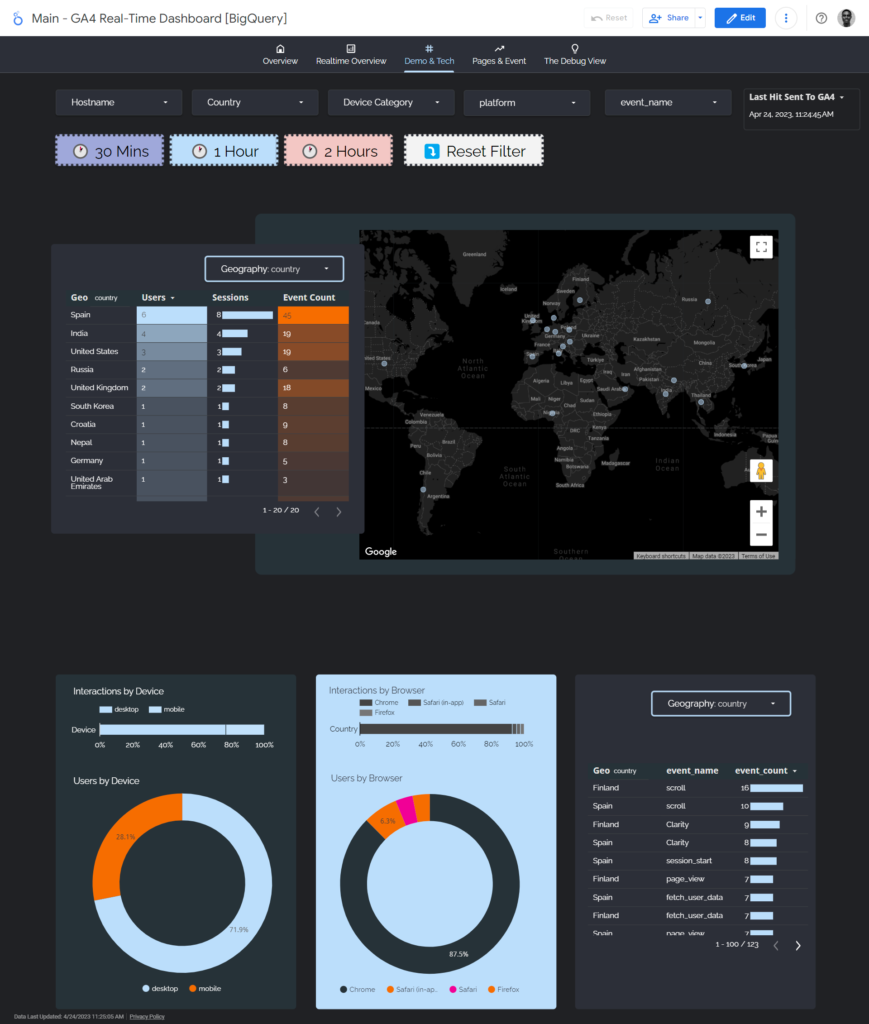
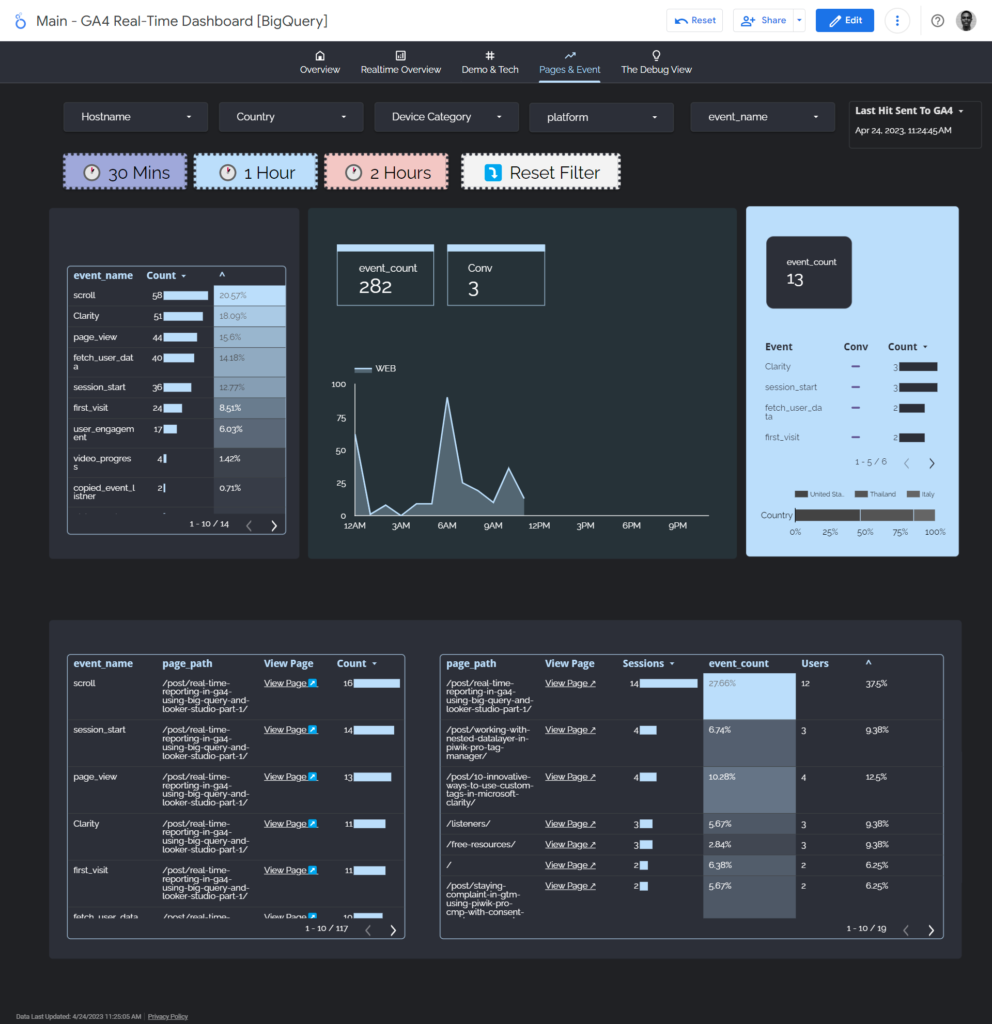
However, I’ll share the screenshots of my dashboard with a video walkthrough of the dashboard, which you can see below.
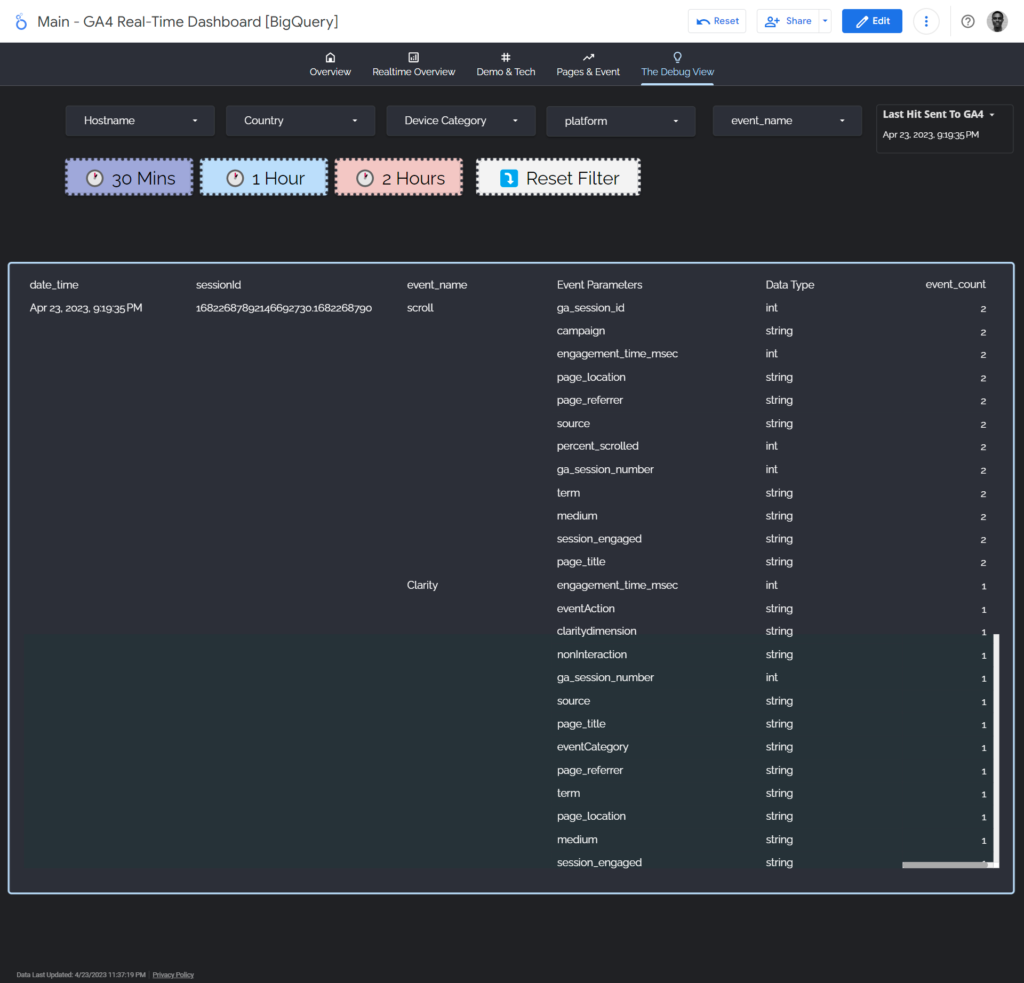
Additionally, I’ll share some of the critical things you’ll need to do to create the metrics in GA4 and the real-time debug view.
Recreating Metrics;
Users:
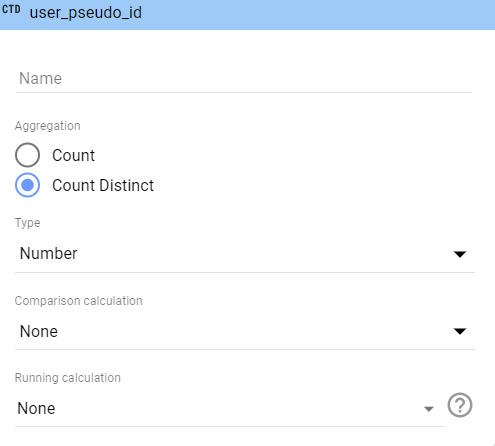
In Non-Calculated Fields Application
To determine the number of website users, you’ll have to apply the “user_pseudo_id” dimension as a metric instead and when applied to the chart, your aggregation method should be. “count_distinct”.
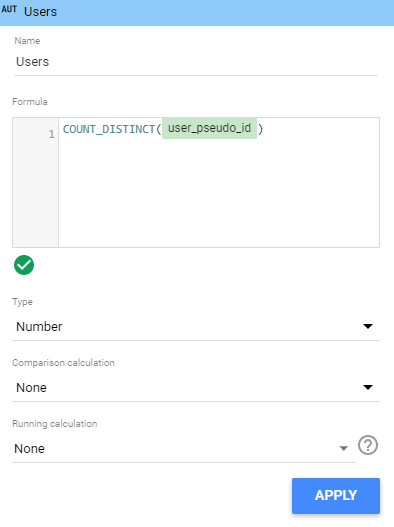
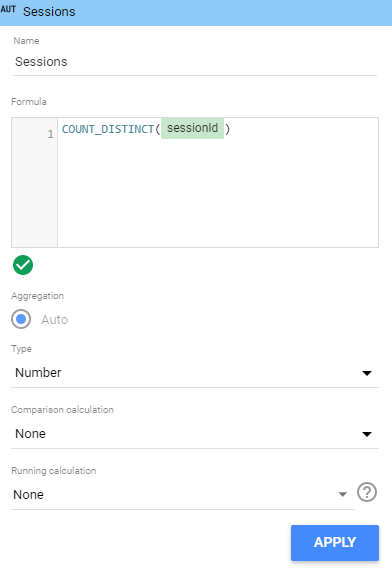
In Calculated Fields Application
If you’re trying to use any mathematical calculations in the calculated fields section, you’ll need to use the “COUNT_DISTINCT” function, as shown below.
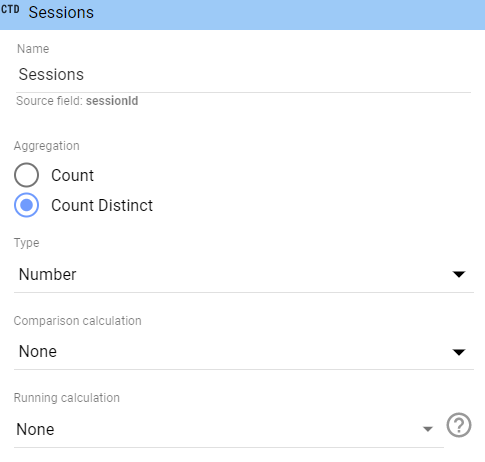
Sessions:
In Non-Calculated Fields Application
To determine the number of website sessions, you’ll have to apply the “sessionId” dimension as a metric instead and when applied to the chart, your aggregation method should be. “count_distinct”.
In Calculated Fields Application
As we did for users, you’ll need to use the “COUNT_DISTINCT” function, as shown below.
We’ll conclude here for part 1, and you can use this link to the second part of this article, which covers the dashboard build in depth.
In the last and following part of this article, which you can access here, we discuss rebuilding the dashboard and sharing a sandbox dashboard you can build upon.
Suppose you want to learn more about GA4, Looker Studio and Big Query. In that case, you can read my previous article on analysing file download events in Google Analytics data using Looker Studio and Big Query.
Looker Studio Dashboard Raw Example
Here is the dashboard sample; we’ve made modifications
Closing The Curtains
We went over real-time reporting in Google Analytics, the limitations of this GA4 feature, and how Big Query and Looker Studio can help us achieve our needs with real-time reporting.
We also understood how to sync our GA4 real-time Big Query table with Looker Studio, using the Big Query native connector and adjusting the data freshness settings.
We went over some of the benefits of this reporting technique. However, we emphasised that real-time reporting of GA4 data may only be necessary for some and should only be adopted when appropriate.
To delve deeper into the topic, you can enhance your understanding by reading the second and final part of the guide on building a Google Analytics (GA4) real-time report using BigQuery and Looker Studio.
Useful Resources;
Like my previous post on using Big Query and Looker Studio to analyse file download events, here are some helpful resources you can check out to navigate the SQL and BQ technicalities.
Note: these are not affiliate links but links to valuable resources that you can use to learn Big Query + GA4;
- Chris Mercer’s Measurementmarketing.io’s Big Query Course – (The membership is great)
- Anil Batra’s Optizent Academy
- Simoahava’s & Johan’s Simmer GA4 + Big Query Course
YouTube Playlist & Videos
- Marketing Watch House – GA4 Video Playlist
- Anil Batra’s Big Query Playlist
- Measuremarketing.io YouTube Video
- Adswerve’s Big Query Video Part 1 and Part 2
Blog Resources;
Ahmed Ali recently launched a tool called “ga4sql.com” for querying the GA4 BigQuery export without writing the SQL code.
Content Contributors

Jude Nwachukwu Onyejekwe;
Loves watching magic videos, and documentaries, writing about measurement and helping non-technical marketers succeed. Jude is a marketing analytics specialist with Hedy and Hopp (a Healthcare marketing agency based in St Louis, US) and DumbData’s co-founder.

Jonah Tochukwu Onyejekwe;
Jonah loves tourism, documentaries, history, marketing and data. Jonah is an analytics specialist with Elevar, your Shopify store’s most important arsenal for growth.