
This is a comprehensive guide on all you need to know about “Annotations” in Mixpanel Analytics.
Welcome to the second episode of our Mixpanel Easy-to-Digest Tips series. In the previous episode, we shared a helpful tip for websites using Mixpanel on the Web, demonstrating how to identify the domains you collect data from in your Mixpanel analytics project. In this concise and current tip, we’ll introduce a valuable Mixpanel feature called “Annotation,” which helps clarify data trends in your reports.
Annotations act like small sticky notes that provide additional context to date-related data trends or actions.
Analysts or marketers working with data in Mixpanel often encounter positive or negative changes in our data trends. It becomes crucial for us to understand the cause behind these changes. However, with so much on our minds, it’s possible to forget the reasons even if we had previously investigated and were aware of the drivers of the trends. We can utilise “annotations” to ensure that we remember and can effectively communicate the causes of such changes to other team members or colleagues using the Mixpanel project.
Data trends can change due to various factors, such as a recently launched campaign, alterations in Google ranking algorithms, the addition of new features, or media PR publications. Remembering what happened on those specific days when the spike, decline, or normalcy impacted your business, based on the data collected in Mixpanel, can be challenging.
Fortunately, Mixpanel Analytics offers a valuable solution in the form of annotations. This feature allows you to add context to observed data trends, thereby clarifying the results in your Insights report.
It’s essential to emphasise that Mixpanel Annotations are associated with specific dates on the chart rather than individual data points on the chart.
If you prefer automation, Mixpanel also provides the Mixpanel Annotations API, enabling you to programmatically apply annotations (e.g., on new application deploys). However, this article will not cover detailed instructions for utilising this API.
Where Can You Apply Annotations In Mixpanel?
In your Mixpanel Analytics project, you have the option to add detailed annotations directly to the line chart in the following types of reports:
- Funnels – when using funnel trends.
- Insights – applicable to both line and stacked line charts.
- Retention – when using retention trends.
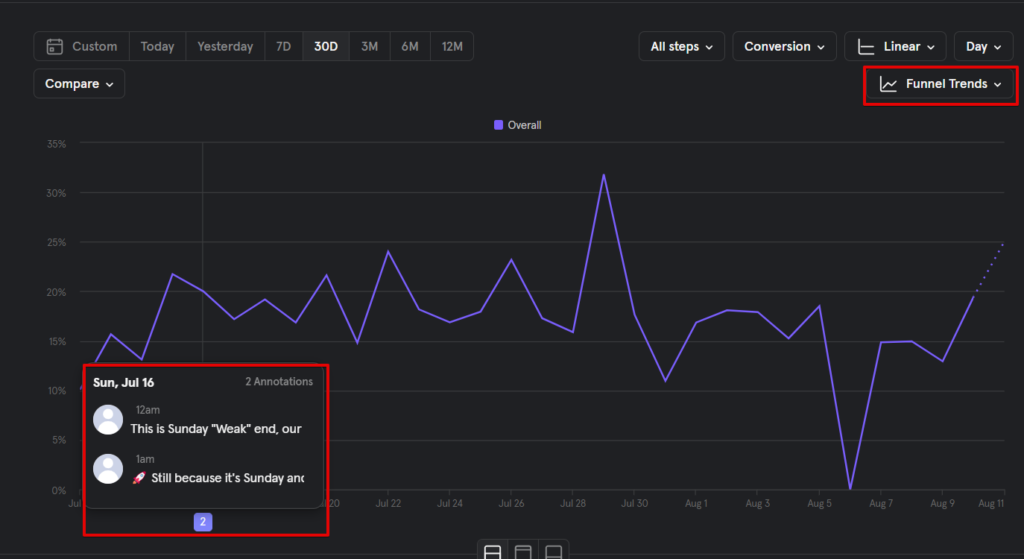
Annotation in Funnels report type when using funnel trends.
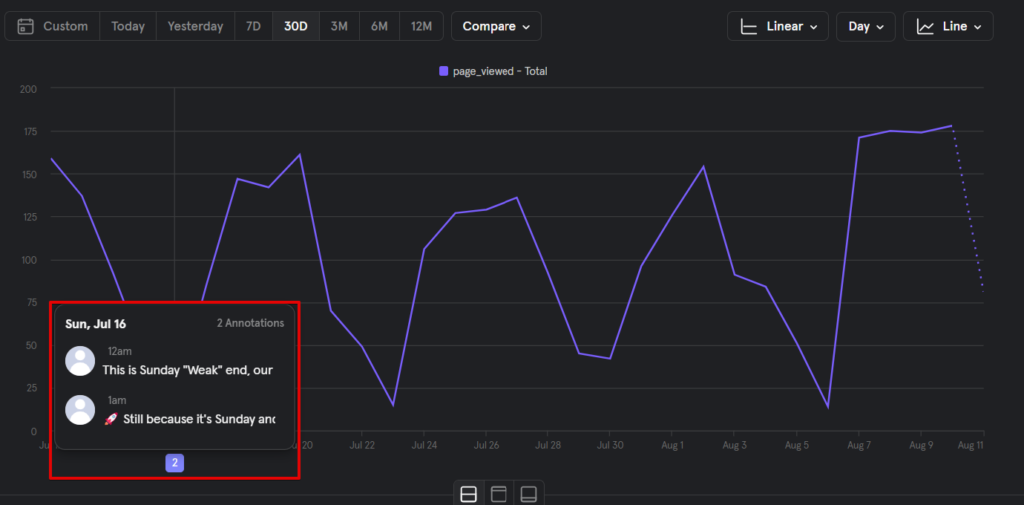
Annotation in Insights report type, which is applicable to both line and stacked line charts
Annotation in Retention report type when using retention trends.
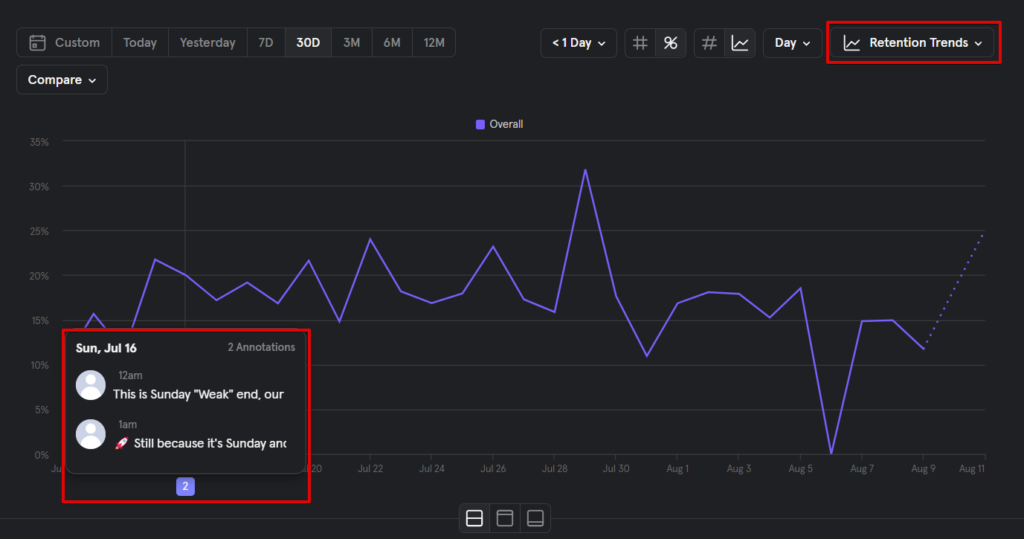
It’s important to note that you can also delete any added annotations if they are no longer useful or necessary. Also, keep in mind that you can add multiple annotations to a specific date on your Mixpanel chart.
To access the Mixpanel Annotation feature, you must be the Mixpanel project admin. This allows you to create, save, and delete annotations as needed.
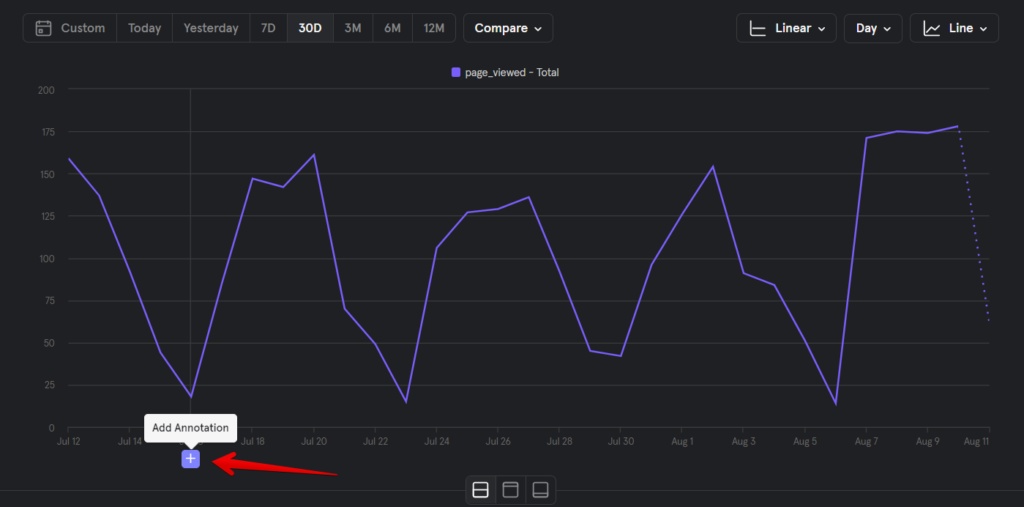
Adding Annotations to Your Mixpanel Chart
To include an annotation, simply hover your mouse over the specific point on the chart you wish to annotate and click on the blue plus “+” button appearing at the bottom of the chart.
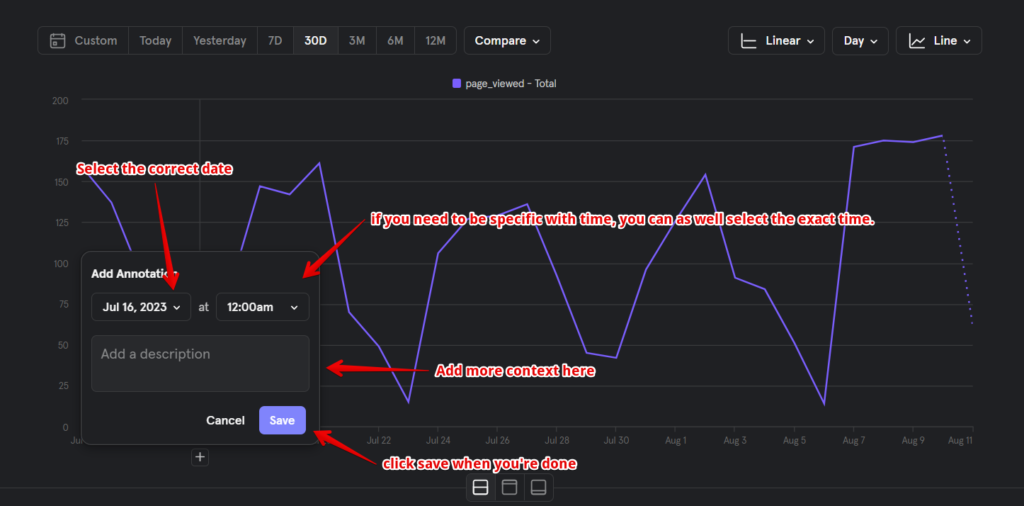
In the new window, you’ll have to provide a piece of descriptive information for the annotation, such as indicating the introduction of a new pricing plan, the launch of a new feature, the termination of a Black Friday campaign, the sunset of a particular product feature, or the conclusion date of your business’s fiscal year. Then, click on the Save button.
*It’s important to note that it’s emoji friendly too.
If you mistakenly select the wrong date on the chart, you can modify the date and time of the annotation within this window.
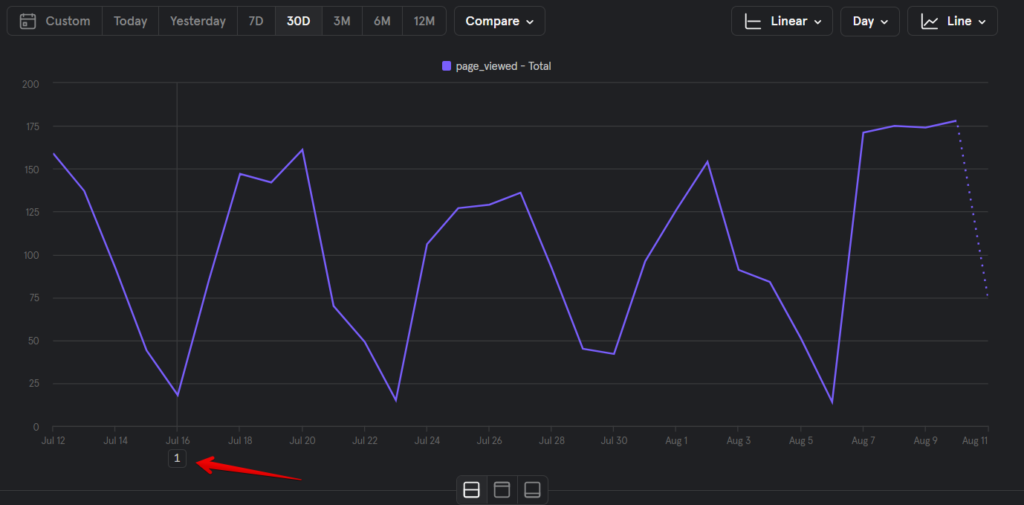
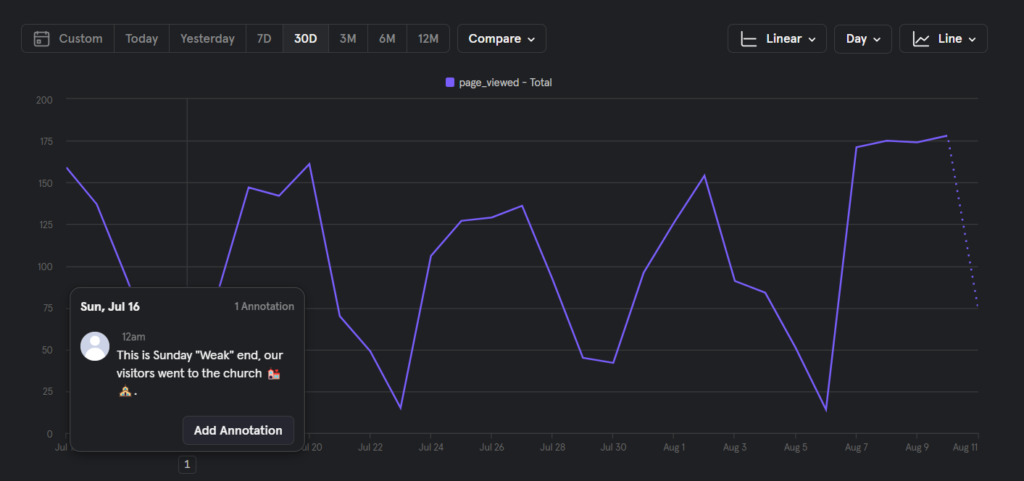
To view an existing annotation, click on the number located at the bottom of a report. This will enable you to see who submitted the annotation.
The annotation will be displayed as shown in the image below.
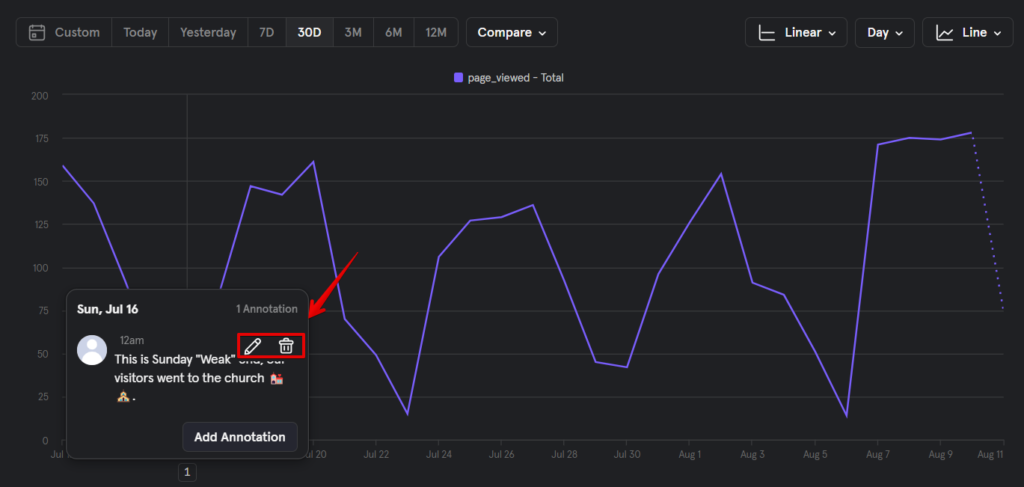
In the same view, you can edit the description or context of an existing annotation by clicking on the pencil icon or delete it by clicking on the trash icon.
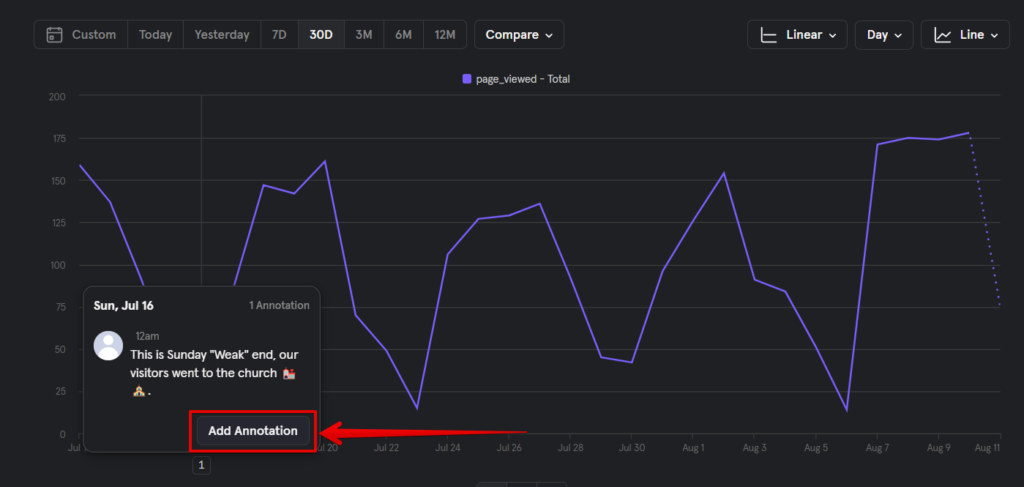
Moreover, you have the option to click the “Add annotations” button to append additional annotations to the same date on the chart.
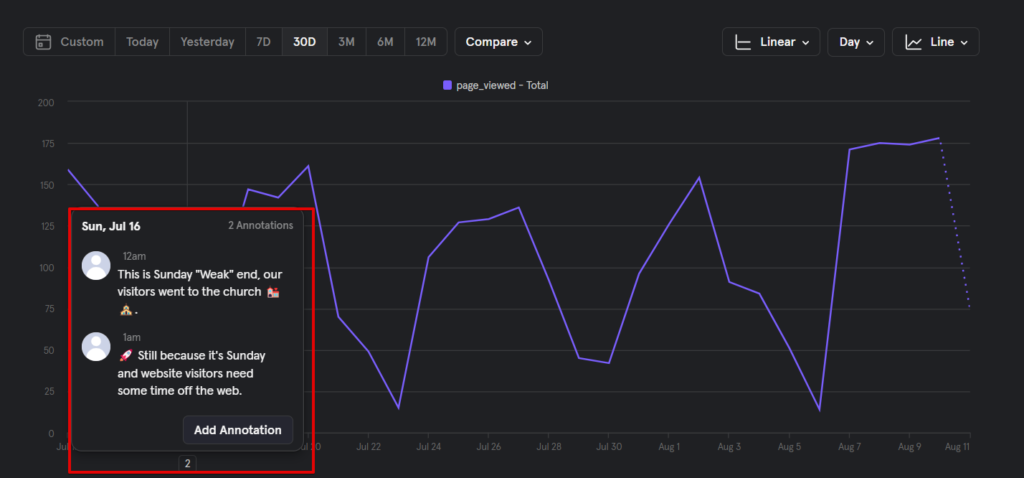
In the example below, there are two annotations added for the same date but at different times of the day.
Conclusion:
With this, we conclude our second episode of Mixpanel tips, where we covered the concept of annotations and how to utilise and manage them in your Mixpanel project.
This insightful feature of Mixpanel enhances the context of your data during analysis.
If you found our Mixpanel tips helpful, consider signing up for our Newsletter to receive notifications when our new Mixpanel tips episodes are released. Until then, happy Mixpaneling!