


A comprehensive guide on how you can use Google Analytics (GA4) cohort exploration report to answer business retention questions about the repeat purchase behaviour of your website visitors.
The versatility of the Google Analytics (GA4) cohorts analysis report makes it an excellent tool for exploring and answering retention-related business questions; although their sophisticated tools out there can also help you with this, that’s not the focus of this blog post. This article does delve into the specifics of the GA4 cohort exploration report. Instead, I will briefly explain what a cohort means and touch on the basic aspect of this Google Analytics reporting feature.
The main focus of this article is to demonstrate how to effectively use cohort exploration to understand the number of users or their percentage who return to your website for another purchase after a previous one or, optionally, start another website session, which translates to another visit, over a period of time.
While we will primarily concentrate on e-commerce purchases, it’s worth noting that with a slight modification, the approach explained in this article can also yield valuable insights for any retention report you intend to create. This report can be equally beneficial for understanding retention and obtaining actionable insights for lead generation or non-e-commerce websites.
What is a Cohort Group?
A cohort refers to a specific user group with a common characteristic or attribute. For instance, users with the same “Acquisition Date” belong to the same cohort. At the same time, website visitors who have performed a particular website action exhibit similar behavioural traits within their cohort group.
Google Analytics (GA4) Cohort Exploration Report
The GA4 Cohort Exploration is one of the six (6) reporting techniques available to analysts within the GA4 report exploration interface. It empowers you to delve into specific user groups’ behavioural traits and attributes over time on your app or site.
The Google Analytics Cohort Exploration process begins by identifying users who meet your criteria for inclusion and return in your report. Each row in the table chart corresponds to a distinct cohort, while each column represents a different time period, ranging from daily, weekly, to monthly granularity. Utilizing the GA4 cohort exploration data table allows you to observe each cohort’s user count throughout the duration.
Cohort Analysis proves to be a highly valuable feature for marketers seeking insights into business retention trends. Analysts widely employ it to gauge the business’s performance concerning user retention. However, we will adopt a different approach in this guide, which you’ll soon discover and learn about.
Why Use Cohort in This Case?
A user retention cohort table or chart can prove immensely beneficial for the following reasons:
- It provides insights into the specific periods when you are more likely to retain users as loyal customers and when they are less likely to complete your business-critical actions.
- By breaking down the data using dimensions, it facilitates the identification of the most influential segments in driving customer retention.
- It enables the analysis of user behaviour for those who have recently churned, allowing further investigation to understand the reasons behind their departure.
- As an analyst, it helps you comprehend how user engagement and retention criteria evolve over time for different user segments with shared attributes.
What Question Do We Intend to Answer?
Before delving into the usage of Google Analytics (GA4) cohort exploration to answer our question, it’s essential to understand certain technicalities regarding this report:
- Cohorts are based solely on user device data, and User-ID will not get considered during cohort creation.
- In GA4, the cohort exploration report can display a maximum of 60 cohorts (user groups).
- Thresholding may get applied to the Google Analytics cohort exploration report without you even using a breakdown dimension. If the number of users in the cohort is too small to protect their anonymity, they will not get included in the exploration.
- Using a shorter time frame in your GA4 data stream, specifically “Override cookie settings,” will impact how users in the cohort are counted over time in the exploration.
Johan Van de Werken’s article on achieving similar results using BigQuery and Looker Studio is a viable option for those seeking alternatives to bypass these limitations. However, this article focuses on creating the exploration report within GA4.
Our Business Retention Question:
We aim to utilize Google Analytics 4 (GA4) to comprehend the retention and churn rate of return purchasers on our website. Specifically, we will analyze website visitors who have made a purchase and subsequently return to place another order.
Additionally, we will create a separate cohort report for those who return to start another session on our website. Through cohort analysis, we intend to gauge stickiness or brand loyalty, which entails observing how these website visitors come back to complete these two separate return actions over a period of time. The time frame can be weekly or monthly, depending on the type of items sold on your e-commerce website.
For those in the lead generation business, it’s possible to adapt and customize the approach discussed in this article to suit your specific kind of business.
There are numerous creative ways to utilize cohort exploration, which could be the topic of a separate blog post in the future. Still, it should always align with your business retention question.
With that in mind, let’s now delve into creating the cohort exploration within the GA4 exploration interface.
How to Create the Cohort Exploration Report for Repeat Purchase Retention
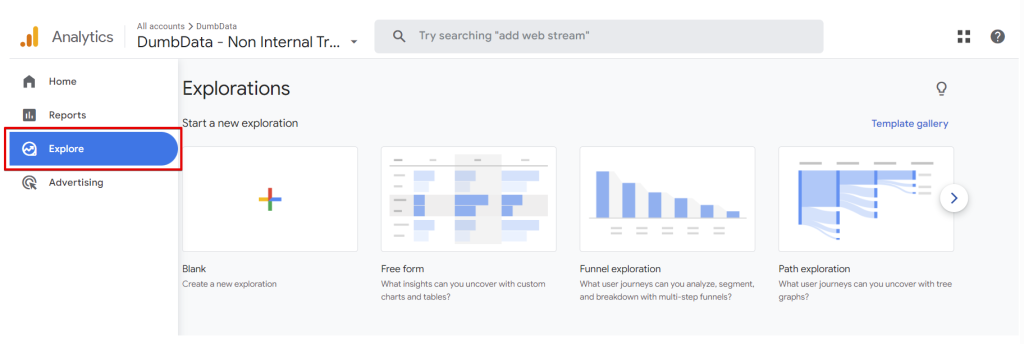
To begin, navigate to the “Explore” tab on the left-hand side of your Google Analytics interface, which will lead you to the exploration reports.
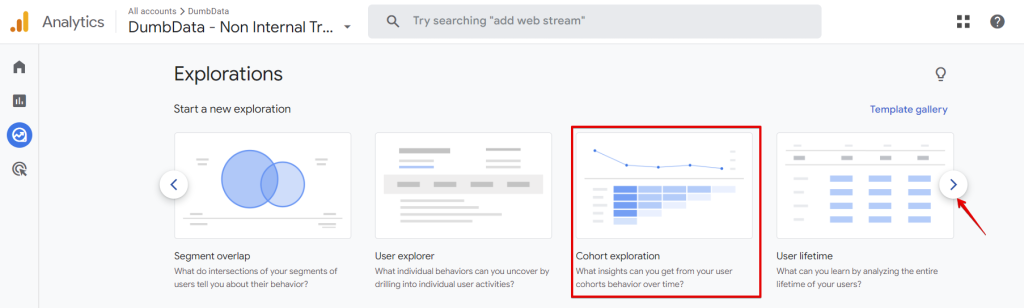
Once on the exploration screen, you have multiple options for creating a cohort exploration report. You can either click on the “Template Gallery” and select “Cohort exploration” or use the navigation arrow to access the “Cohort report.”
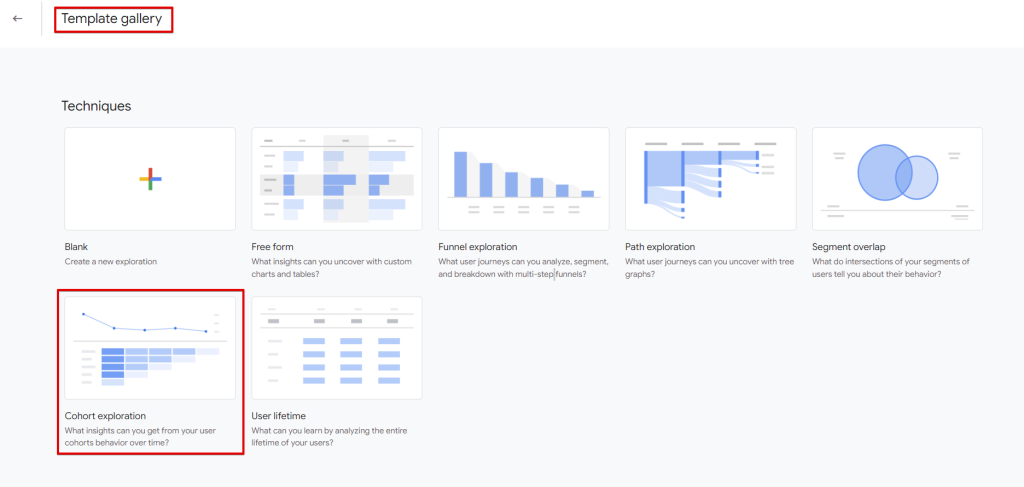
Using the template gallery to find the Google Analytics cohort exploration report type.
You can also choose the blank report, but you’ll have to choose “Cohort Exploration” as your reporting technique.
Next, under the “Variables” tab, adjust the date ranges to your desired specifications. In the “Tab Settings” section, you’ll need to input the values for “Cohort Inclusion” and “Return Criteria.”
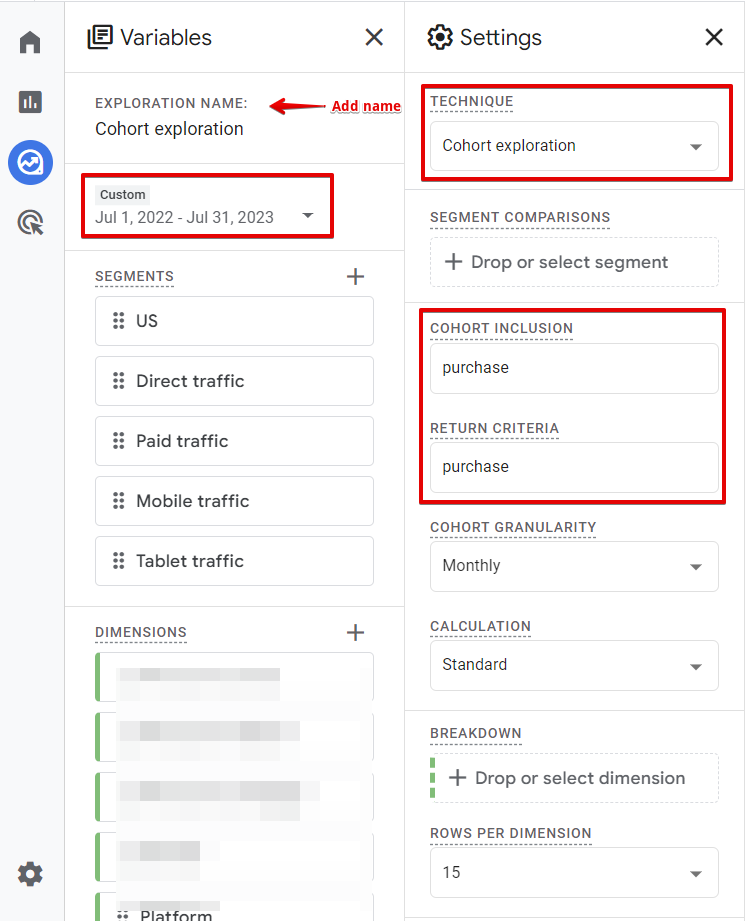
Cohort Inclusion:
The cohort inclusion action can either be “any transaction” or the “purchase event“; both options should be adequate for what we intend to achieve with cohort analysis.
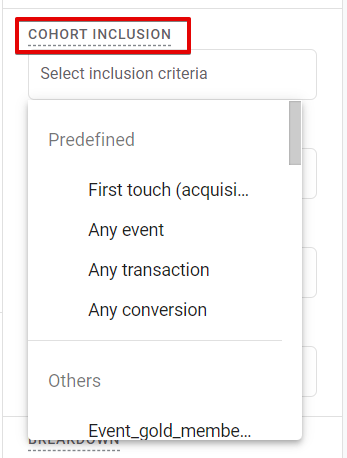
In the GA4 demo property, the “purchase” event appears to have a higher count than “transactions.” You should verify if this holds true for your property as well.
It’s essential to note that using either the GA4 “purchase event” or “any transaction” as inclusion criteria signifies the first occurrence of a user’s transaction or purchase event within the specified exploration date range.
Users are placed in all cohorts that meet the inclusion criterion. For instance, if you select “transactions” as the inclusion criterion, a user who completes a conversion event every week of the exploration timeframe will be assigned to each row (cohort) in the table.
Return Criteria:
Regarding the return criteria, we will add either the “purchase event” or “any transaction” as the requirement for a user to be included in the cohort.
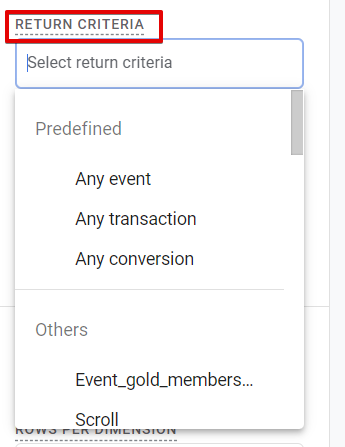
Selecting “any transaction” or “purchase event” as the return criteria means that the user must have returned to make at least one (1) transaction event within the exploration time period.
If you choose to add the “session_start” event for the second report, it will allow you to determine if the user revisited after making a purchase.
A vital point to remember is to use either the “purchase” event or the “any transaction” action consistently as both your inclusion and return criteria in the Google Analytics cohort report. Mixing them in a single exploration report may lead to confusion and inaccurate results.
Cohort Granularity:
The application of granularity in your exploration report depends on the type of product you sell on your website. In a GA4 cohort exploration report, time granularity defines the time frame for both the initial and returning cohorts.
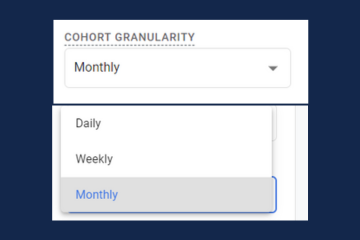
The return time granularity aligns with the cohort granularity. You can select from the following options, and it’s crucial to understand how they impact data interpretation:
- Daily: This option encompasses the time from midnight to midnight in the property timezone.
- Weekly: It includes the time from Sunday to Saturday, and it’s not based on a rolling 7-day period.
- Monthly: This option covers the time from the beginning to the end of the month.
It’s worth noting that daily cohort granularity is not an option here, as it’s not expected for a user to make a purchase today and return the next day to make another one on the website. We do not sell substances or addictive drugs on the website that might lead to such behaviour.
Understanding how GA4 handles these calculations is essential, as it determines how you interpret the report and share the insights with other stakeholders. In the upcoming sections, I will cover the different calculations available to you and explain what each of them signifies.
Cohort Calculation:
The cohort calculation determines how user activity during the exploration period contributes to the metric calculation in each exploration cell. Three (3) types of cohort calculations can be applied to your exploration:
1. Standard:
In this calculation, each cell includes all cohort users who meet the return criteria for that specific period, irrespective of their activity in other periods. The metric displays the total value for that individual period.
Simply put, it counts the users who meet the return criteria for that particular period.
2. Rolling:
In the rolling calculation, each cell includes all cohort users who meet the return criteria for that period as well as all previous periods. The metric displays the total value for that individual period.
Simply put, it counts the users who meet the return criteria for that specific period and the previous periods where they’ve previously completed the return action.
3. Cumulative:
In the cumulative calculation, each cell includes all cohort users who meet the return criteria in any period within the exploration. The metric displays the cumulative total value for each period.
Cohort Reporting Metric Type:
As a marketer or analyst analyzing and interpreting this data, it’s essential to understand the two different metric types applicable to a GA4 cohort exploration report:
1. Sum:
As the name suggests, it represents the number of users who satisfy the inclusion criteria and then returns to complete the return condition, which, in our case, is the GA4 “purchase event” or “any transaction,” depending on your choice.
Remember that the Cohort exploration calculation method affects the value of the “Sum” metric type.
2. Per Cohort User:
Applying this metric type signifies that you are trying to determine the percentage of users in the cohort who return to complete the return action. Subtracting this value from 100% gives you the number of website visitors that churn.
Similar to the applied calculation method, the “Per Cohort User” metric type also gets impacted by it.
Making Sense Of The Data In Our GA4 Cohort Exploration
The GA4 demo store isn’t the most suitable property for conducting this type of analysis. I observed that their purchase tracking recorded zero purchase data for a certain period, which is rather unusual. Nonetheless, I will utilize their property for the purpose of this analysis, implementing the following configuration:
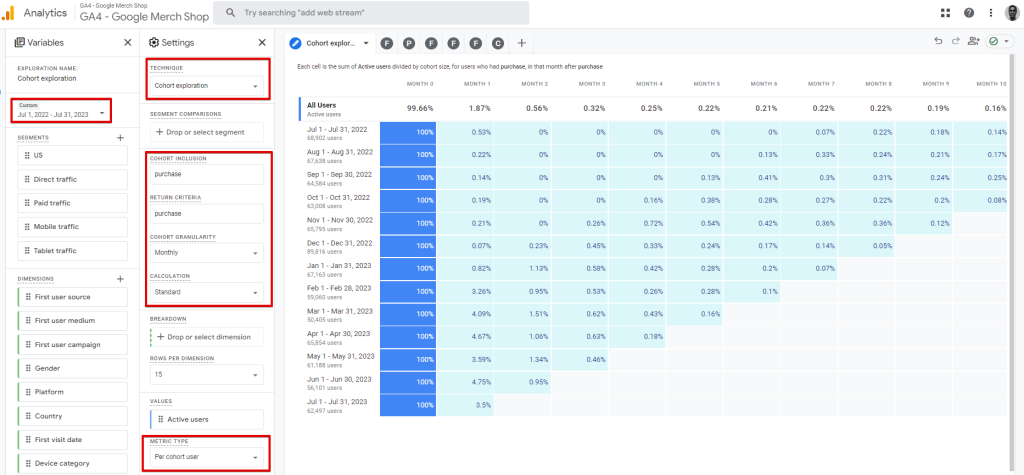
- Date range: July 1, 2022, to July 31, 2023
- Cohort granularity: Set to “monthly.”
- Cohort report calculation: Set to “Standard.”
- Metric type: “Per cohort user.”
- Inclusion and return criteria actions: Both are set as “Purchase” event
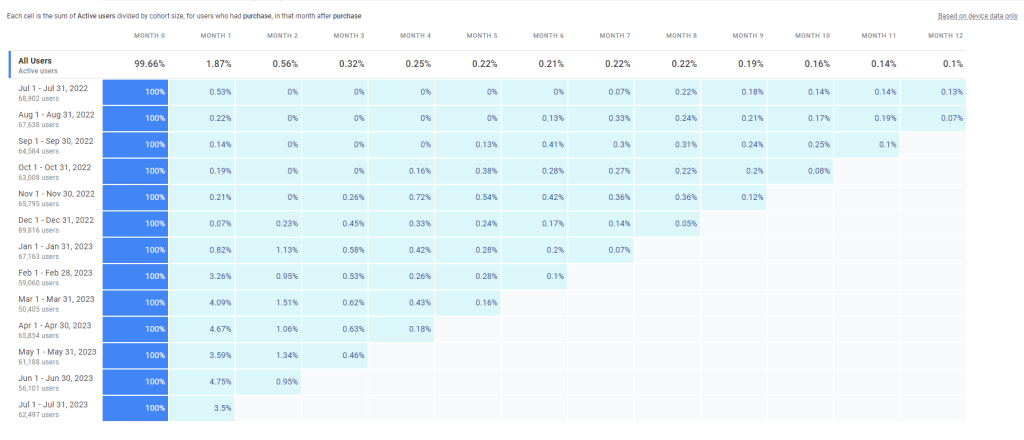
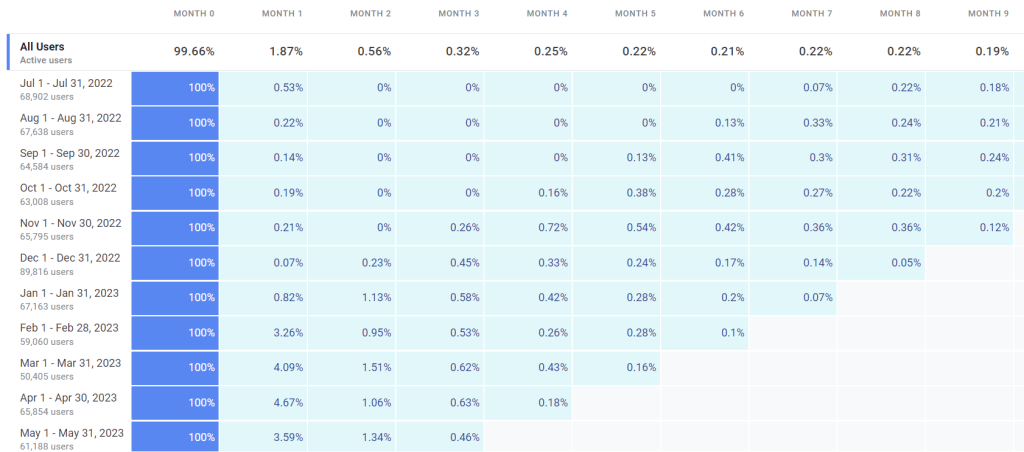
In the Google Analytics cohort report exploration chart, utilizing the top average for each monthly column, we can discern that the likelihood of converting a website purchaser into a repeat customer diminishes after the third month, with a churn rate of 99.69%. Furthermore, the chart indicates that the store has a window of 60 days to encourage a website visitor to become a repeat customer.
Additionally, we can infer that users making purchases between February and May are inclined to make another purchase within three months from the present time. This presents an avenue for further investigation.
While there’s more to explore, I’ll halt here. It’s not just about gaining these insights but also acting upon them. Enhancing your retention strategy based on these findings could involve offering time-bound incentives like discounted points, offers, or coupons expiring within two months from their purchase date. This approach can help cultivate the habit of repeat purchases on your website. Furthermore, you might discover that a specific marketing channel is driving valuable customers—a point that warrants deeper investigation and corresponding action.
Remember, industries and strategies differ among businesses. When crafting your business cohort exploration for repeat purchases in Google Analytics (GA4), keep these variations in mind.
Conclusion
And that brings us to the end of our journey. Let’s take a moment to reflect on what we have covered in this blog post. We began by understanding the concept of cohorts and what a cohort report means in the context of GA4. We then delved into the process of creating a cohort report, exploring the technicalities involved in GA4 cohort exploration.
Identifying a business question, using an e-commerce business as an example, we provided a detailed guide on how to answer the question using the GA4 cohort exploration report for business retention analysis.
If you have any additional inputs or thoughts you’d like to share, feel free to reach out to me on LinkedIn. I would be delighted to hear from you.
Remember to subscribe to our newsletter and happy data analysis for valuable insights!