


This article will take a quick look at another Google Analytics 4 (GA4) + Big Query and Looker Studio use case. We’ll use Big Query and Looker Studio to analyze and visualize GA4 file download event data.
At the end of this content, you’ll have a Looker Studio template + SQL queries for analyzing and visualizing GA4 file downloads events.
DISCLAIMER: I am not an expert in SQL or Big Query. I am still learning the weeds of SQL and Google Big Query, and I’ll also recommend some helpful paid courses, free resources and a YouTube playlist at the end of this blog post.
Let’s get the party started.
You might ask, why should I use Big Query to visualize my Google Analytics 4 file downloads event when I can use the GA4 native connector?
Here are some of the reasons why Big Query is your best bet for this task;
- GA4 API quota limit is still a thing
- Not all standard event parameters are available as a dimension in Looker Studio, so you’ll need to register the file_dwonload event parameters as a custom dimension to make them available in Looker Studio.
- GA4 + Big Query gives much flexibility with what you can do with your analytics data.
- Reporting speed is incredible.
And lots more.
The roadblocks when using Big Query + GA4 and Looker Studio to analyze and visualize website file download action are;
- You need to understand SQL.
- Your GA4 property has to be linked to a Google Big Query project.
- You need to track file_download as an event through enhanced measurement, GTM or both.
But not to worry, I have prepared the SQL queries you will use for all these cases.
Remember to update the SQL table reference statement with your table’s name and change the “.com” in the “page_path” statement to your domain suffix.
Scenario 1: Doing Only Analysis In Big Query
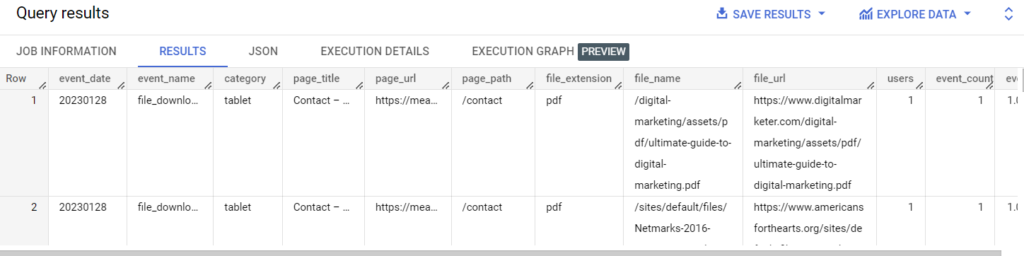
If all you want to do is use only Big Query to analyze just GA4 file_download event data without source and medium information, you can use this SQL query.
SELECT
event_date
,event_name
,device.category
,(SELECT value.string_value FROM UNNEST(event_params) WHERE KEY = "page_title") as page_title
,SPLIT((SELECT value.string_value FROM UNNEST(event_params) WHERE KEY = "page_location"), '?')[offset(0)] as page_url
,REGEXP_REPLACE(SPLIT((SELECT value.string_value FROM UNNEST(event_params) WHERE KEY = "page_location"), '?')[offset(0)], "http(s)?\\:.*\\.com", "") as page_path
,(SELECT value.string_value FROM UNNEST(event_params) WHERE KEY = "file_extension") as file_extension
,(SELECT value.string_value FROM UNNEST(event_params) WHERE KEY = "file_name") as file_name
,(SELECT value.string_value FROM UNNEST(event_params) WHERE KEY = "link_url") as file_url
,COUNT(DISTINCT (user_pseudo_id)) users
,COUNT(*) event_count
,( (COUNT(*)) / (COUNT(DISTINCT (user_pseudo_id)))) as event_count_per_user
FROM `coffeetribega4.analytics_276347190.events_*`
WHERE event_name = "file_download"
GROUP BY 1,2,3,4,5,6,7,8,9
ORDER BY event_date DESC
Image of the expected outcome in Big Query:
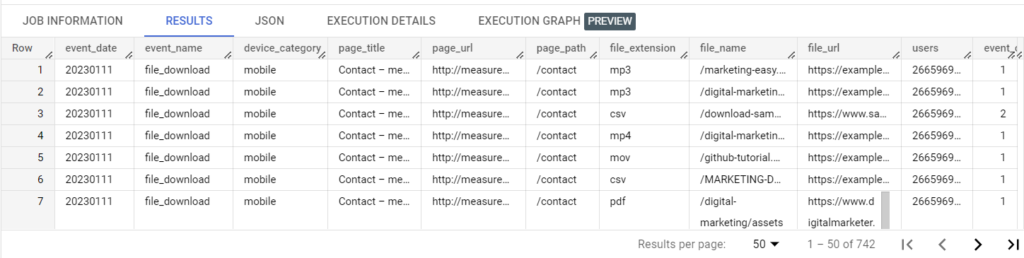
Scenario 2: Analysis + Visualization Using Looker Studio + Big Query (Without Source and Medium)
Use the SQL query below to create your GA4 file_download event data without source and medium information. Then, create a view or schedule your Query before connecting to Looker Studio to visualize your data.
SELECT
event_date
,event_name
,device.category as device_category
,(SELECT value.string_value FROM UNNEST(event_params) WHERE KEY = "page_title") as page_title
,SPLIT((SELECT value.string_value FROM UNNEST(event_params) WHERE KEY = "page_location"), '?')[offset(0)] as page_url
,REGEXP_REPLACE(SPLIT((SELECT value.string_value FROM UNNEST(event_params) WHERE KEY = "page_location"), '?')[offset(0)], "http(s)?\\:.*\\.com", "") as page_path
,(SELECT value.string_value FROM UNNEST(event_params) WHERE KEY = "file_extension") as file_extension
,(SELECT value.string_value FROM UNNEST(event_params) WHERE KEY = "file_name") as file_name
,(SELECT value.string_value FROM UNNEST(event_params) WHERE KEY = "link_url") as file_url
,user_pseudo_id as users
,COUNT(event_name) event_count
FROM `coffeetribega4.analytics_276347190.events_*`
WHERE event_name = "file_download"
GROUP BY 1,2,3,4,5,6,7,8,9,10
Image of the expected outcome in Big Query:
Keep reading to understand how to use this data in Looker Studio.
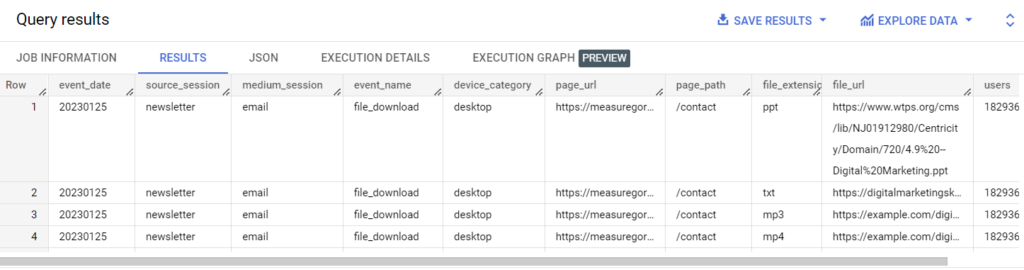
Scenario 3a: Analysis + Visualization Using Looker Studio + Big Query (With Session Source and Session Medium)
The SQL query will help you create an event table that includes the event’s session source and medium parameter.
In Google Analytics 4, there are three types of sources and medium dimensions;
- User source & medium; This Is the source and medium the user came through on their first visit to the website. The dimensions always have the “first user” prefix.
- Session source and medium; The first non-direct source and medium of the user session, the dimensions have a “session” prefix.
- Event Source and Medium; This is the actual event source and medium. The dimensions have no suffixes or prefixes.
SELECT
event_date
,source_session
,medium_session
,event_name
,device_category
,page_url
,REGEXP_REPLACE(page_url, "http(s)?\\:.*\\.com", "") as page_path
,file_extension
,file_url
,file_name
,users
,event_count

FROM
(
SELECT
event_date
,event_name
,device.category as device_category
,(SELECT value.string_value FROM UNNEST(event_params) WHERE KEY = "page_title") as page_title
,SPLIT((SELECT value.string_value FROM UNNEST(event_params) WHERE KEY = "page_location"), '?')[offset(0)] as page_url
,(SELECT value.string_value FROM UNNEST(event_params) WHERE KEY = "file_extension") as file_extension
,(SELECT value.string_value FROM UNNEST(event_params) WHERE KEY = "file_name") as file_name
,(SELECT value.string_value FROM UNNEST(event_params) WHERE KEY = "link_url") as file_url
,user_pseudo_id as users
,CONCAT(user_pseudo_id,(select value.int_value from unnest(event_params) where key = 'ga_session_id')) as stitched_session_id
,COUNT(event_name) as event_count
FROM `coffeetribega4.analytics_276347190.events_*`
WHERE event_name = "file_download"
GROUP BY 1,2,3,4,5,6,7,8,9,10
) as ED

LEFT JOIN (
SELECT
source as source_session
,medium as medium_session
,CONCAT(user_pseudo_id,session_id) as stitched_session_id
FROM(
SELECT
user_pseudo_id
,(select value.int_value from unnest(event_params) where key = 'ga_session_id') as session_id
,max(LOWER(coalesce((select value.string_value from unnest(event_params) where key = 'source'),'(direct)'))) as source
,max(LOWER(coalesce((select value.string_value from unnest(event_params) where key = 'medium'),'(none)'))) as medium
FROM `coffeetribega4.analytics_276347190.events_*`
GROUP BY
user_pseudo_id
,session_id)

GROUP BY
source_session
,medium_session
,stitched_session_id) as TSD
ON ED.stitched_session_id = TSD.stitched_session_id
GROUP BY 1,2,3,4,5,6,7,8,9,10,11,12
Image of the expected outcome in Big Query:
How to use the table in Looker Studio is explained below.
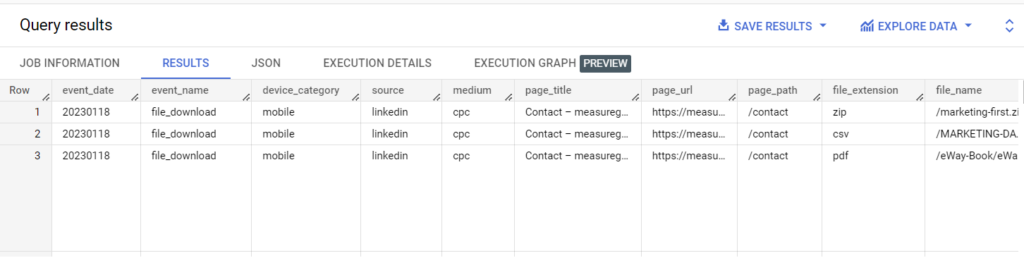
Scenario 3b: Analysis + Visualization Using Looker Studio + Big Query (With Event Source and Medium)
In this scenario, the SQL query will help you create an event table that includes the event’s actual source and medium parameters.
SELECT
event_date
,event_name
,device.category as device_category
,LOWER(coalesce((select value.string_value from unnest(event_params) where key = 'source'),'(direct)')) as source
,LOWER(coalesce((select value.string_value from unnest(event_params) where key = 'medium'),'(none)')) as medium
,(SELECT value.string_value FROM UNNEST(event_params) WHERE KEY = "page_title") as page_title
,SPLIT((SELECT value.string_value FROM UNNEST(event_params) WHERE KEY = "page_location"), '?')[offset(0)] as page_url
,REGEXP_REPLACE(SPLIT((SELECT value.string_value FROM UNNEST(event_params) WHERE KEY = "page_location"), '?')[offset(0)], "http(s)?\\:.*\\.com", "") as page_path
,(SELECT value.string_value FROM UNNEST(event_params) WHERE KEY = "file_extension") as file_extension
,(SELECT value.string_value FROM UNNEST(event_params) WHERE KEY = "file_name") as file_name
,(SELECT value.string_value FROM UNNEST(event_params) WHERE KEY = "link_url") as file_url
,user_pseudo_id as users
,COUNT(event_name) event_count
FROM `coffeetribega4.analytics_276347190.events_*`
WHERE event_name = "file_download"
GROUP BY 1,2,3,4,5,6,7,8,9,10,11,12
Image of the expected outcome in Big Query:
How to use the table in Looker Studio is explained below.
What next?
After you’ve run the SQL query in your query editor workspace, you can do one of the following;
OPTION 1: Schedule the query result.
Scheduling your Query to a new table will ensure that the Looker Studio data source gets updated with recent data from GA4.
Here’s how to go about it;
- Click the schedule dropdown with the clock icon
- Configure your schedule and table settings
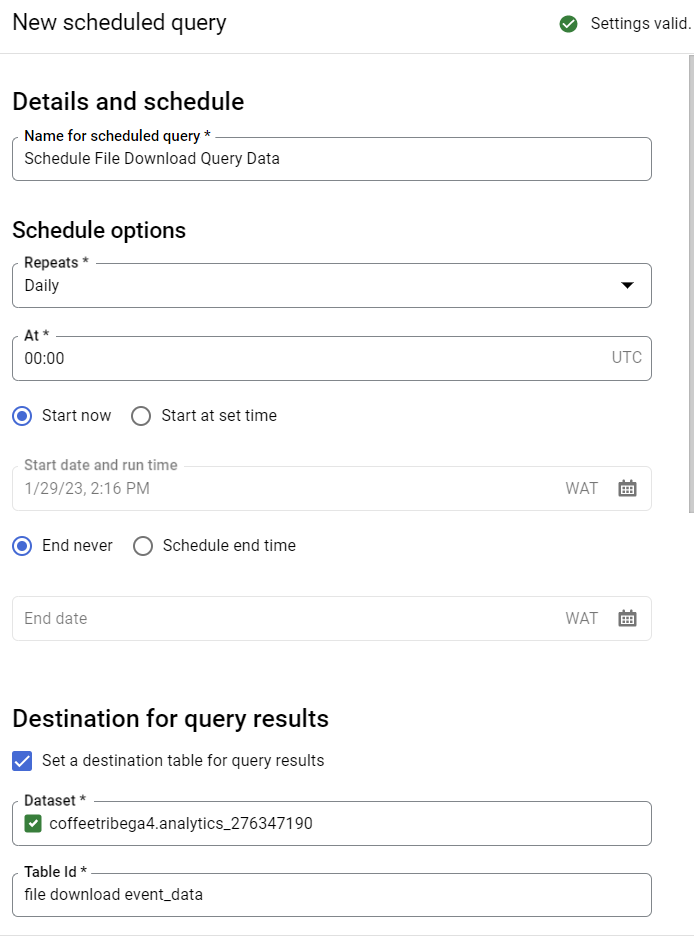
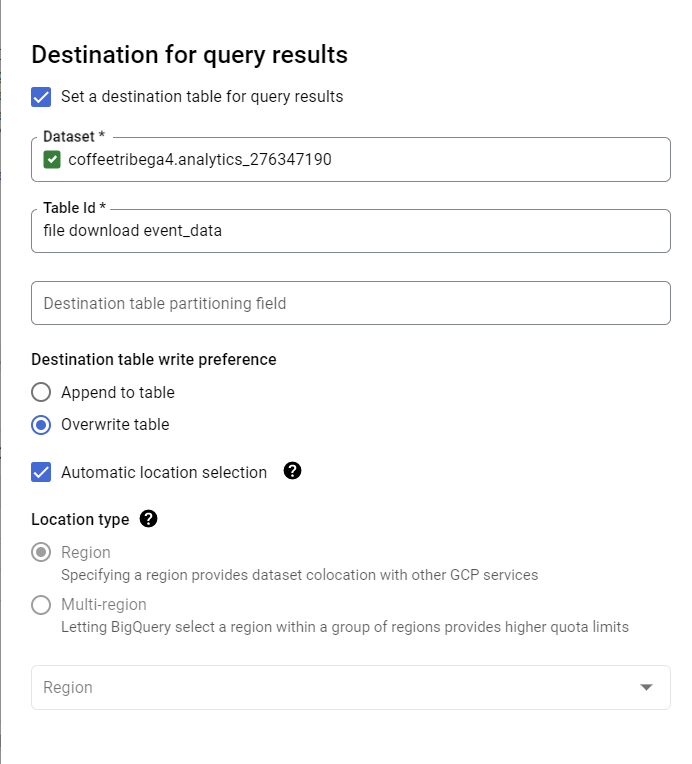
Remember to set the table write preference to “overwrite“.
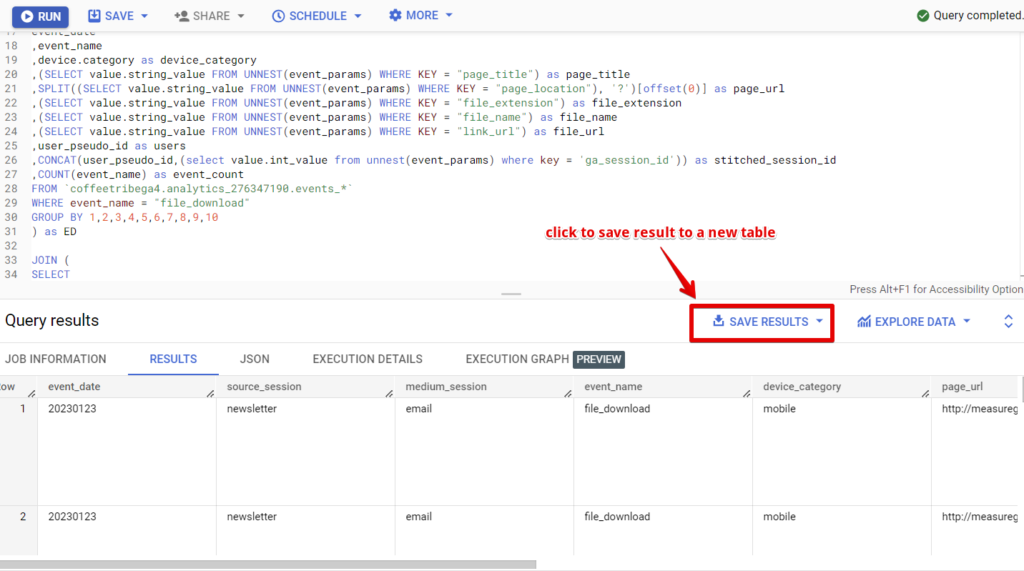
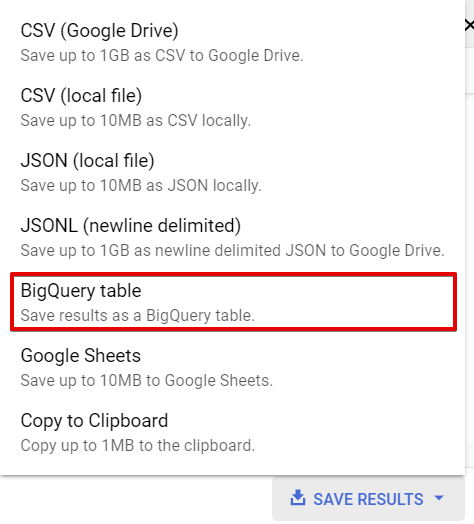
OPTION 2: Save the current table.
I don’t recommend this approach because the table doesn’t get updated with recent GA4 file_download event data, as what gets saved is only the result of the first time you ran the SQL query.
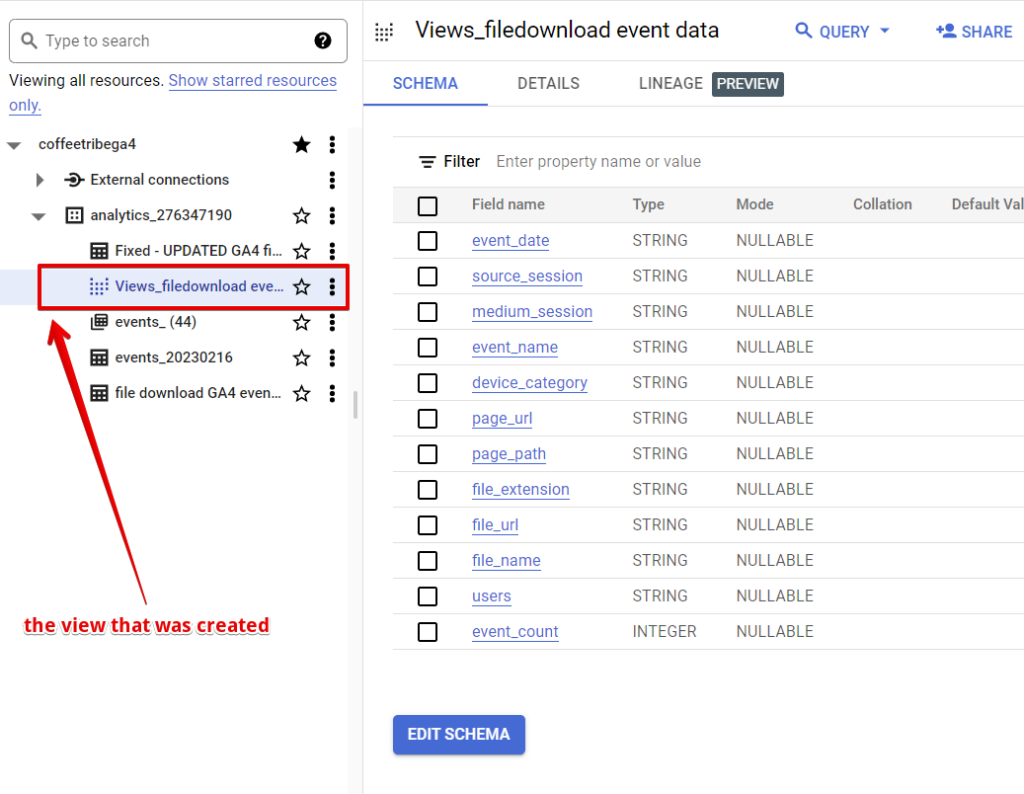
OPTION 3: Creating a view
A Big Query view is a virtual table defined by a SQL query. Views are read-only, and you can’t run Data Manipulation Language queries such as insert, update, and delete against a BQ view.
There are different views type, but I’ll use the standard view type in this scenario. There are various ways to create a view in Big Query, but I’ll make one using the following steps;
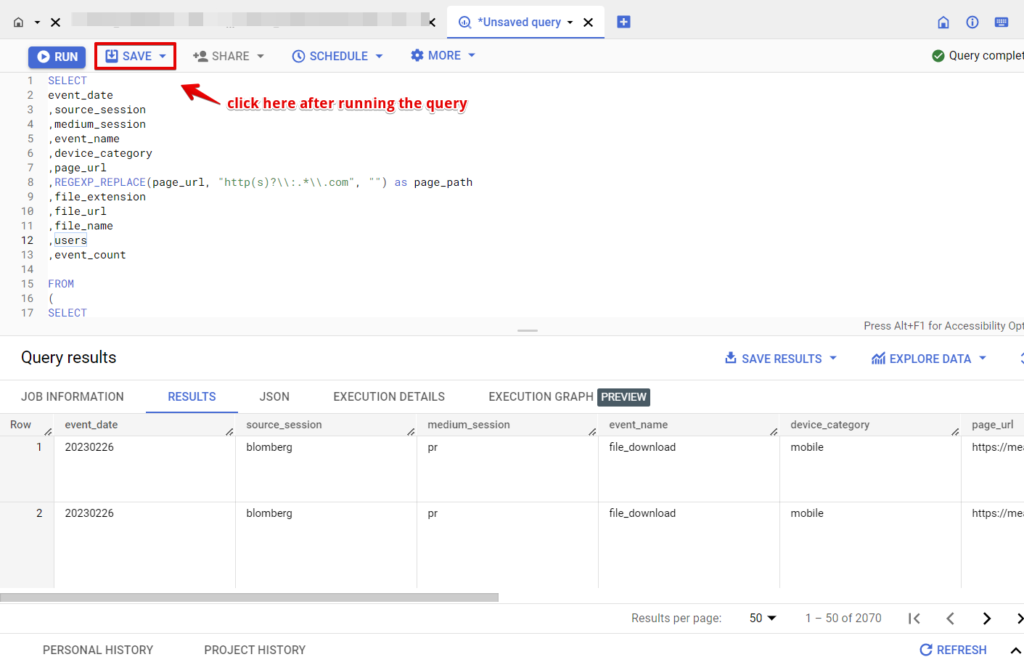
- Run the Query in the SQL workspace,
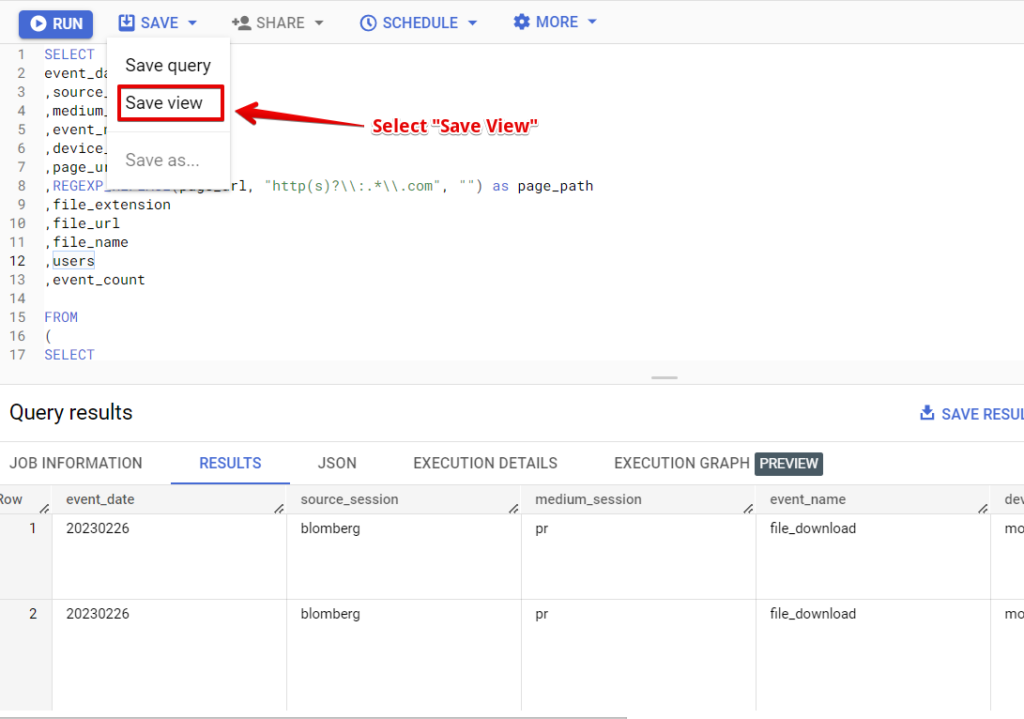
- Click the Save button and select “Save View“.
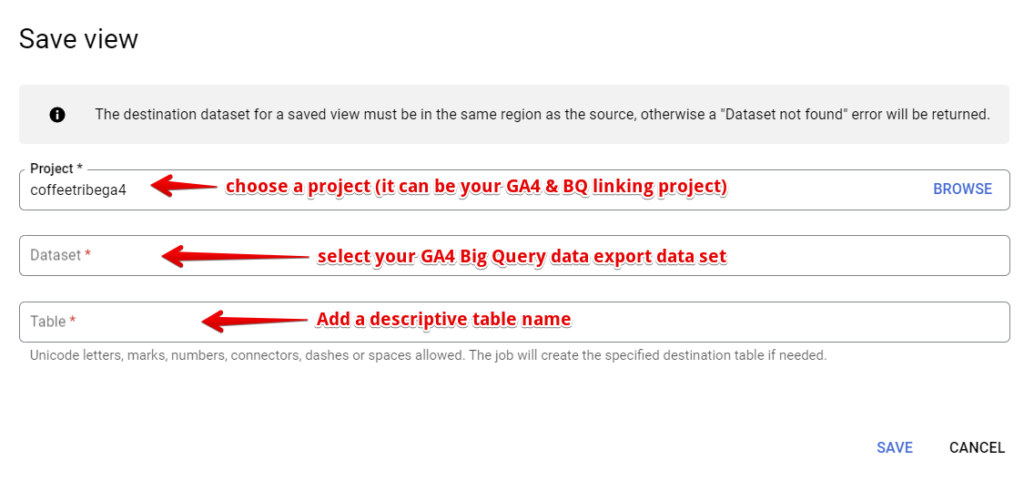
- Select your project,
- Select your GA4 Big Query data export data set
- Add your descriptive table name and click the save button.
All way leads to Looker Studio.
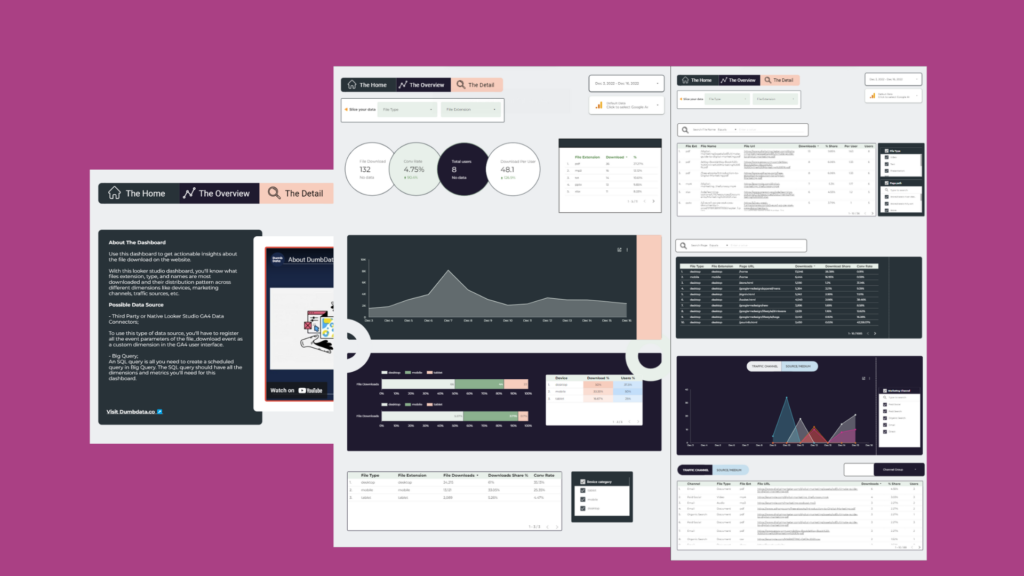
The next step will be to visualize your data in Looker Studio, and you can use the template linked here.
Connect the Big Query table data set using the native Big Query native connector in Looker Studio.
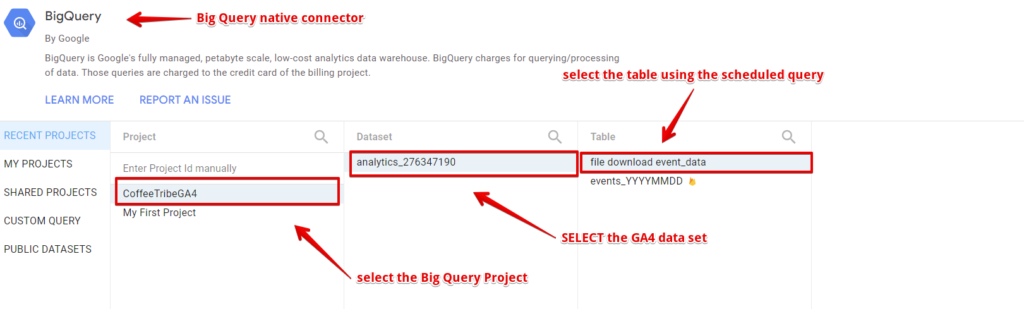
You can select the Big Query view you created using the same Big Query looker connector.
Calculated fields to the rescue.
You’ll have to use calculated fields to get the total website users and event count per user in Looker Studio.
Here is the formula “SUM(event_count) / COUNT_DISTINCT(users)” for event count per user
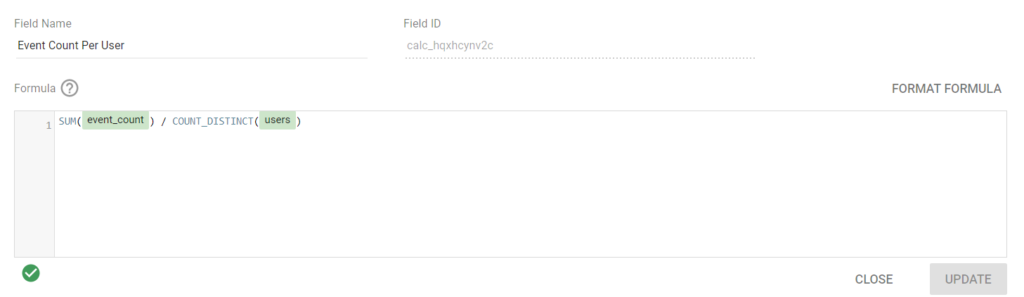
While to get the total users, you can either add the “users” dimension as a metric and set the record count to count_distinct OR use calculated fields.
Goodies time (Free Looker Studio Template)
You can use our GA4 file_download looker studio template to quickly generate a report for your business.
Useful Learning Resources:
Note: these are not affiliate links but links to valuable resources that you can use to learn Big Query + GA4;
- Chris Mercer’s Measurementmarketing.io‘s Big Query Course – (The membership is great)
- Anil Batra’s Optizent Academy
- Simoahava’s & Johan’s Simmer GA4 + Big Query Course
YouTube Playlist & Videos
- Marketing Watch House – GA4 Video Playlist
- Anil Batra’s Big Query Playlist
- Measuremarketing.io YouTube Video
- Adswerve’s Big Query Video part 1 and part 2
Blog Resources;
Time to say goodbye
Finally, you’ve come to the end of this article, and we’ve understood why Google Big Query + GA4, the different types of source and medium dimensions, seen the SQL queries used and got access to a free plug-play Looker Studio template.
Content Author:
This lovely piece was written by Jude Nwachukwu Onyejekwe, an analytics specialist with Hedy and Hopp (an Health Care marketing agency) and DumbData’s co-founder.