

In this blog post, I’ll show you how to use Google Analytics (GA4) to determine how many users stop visiting your website after completing a critical business action, such as a conversion (key event), a specific event, or a purchase, within a specific time frame.
This time frame, referred to as “N” days, could be 7, 14, 30 days, or any other period based on your business retention goals (however limits do apply).
Additionally, the approach I’ll be going over in this guide can help you analyze how many website visitors become inactive after their last session within the designated “N” days.
Plus, you’ll also discover how to leverage GA4 to identify users who have been inactive for a specific period after completing key actions, such as making a purchase or converting.
I’ll also show you how to create GA4 audiences from these behavioural segments and activate this data in Google Ads for remarketing campaigns.
To add a touch of innovation, we’ll explore creative ways to use this segmentation technique for marketing strategies focused on re-activating inactive users/customers. If that sounds interesting, let’s dive straight into the details!
Using Google Analytics (GA4) to Analyze N-Day Inactive Visitors:
Google Analytics 4 (GA4) makes answering business questions about user inactivity easy.
Whether you’re looking to determine how many users became inactive after “N” days of their last visit, purchase, conversion, or other critical business actions, GA4’s Exploration reports provide a simple and effective solution.
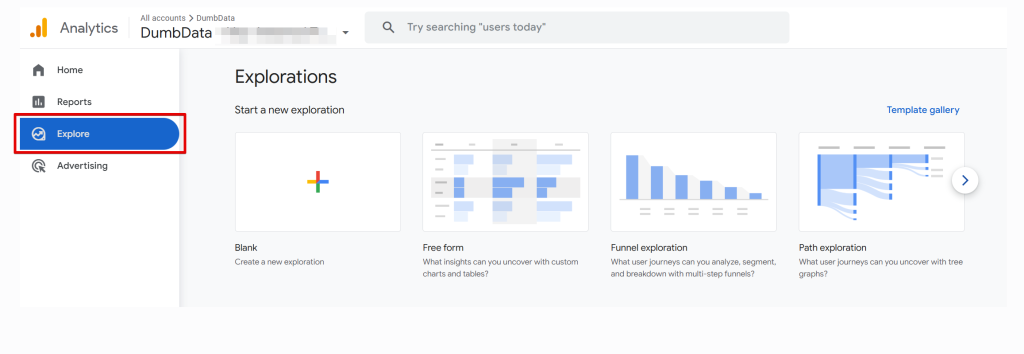
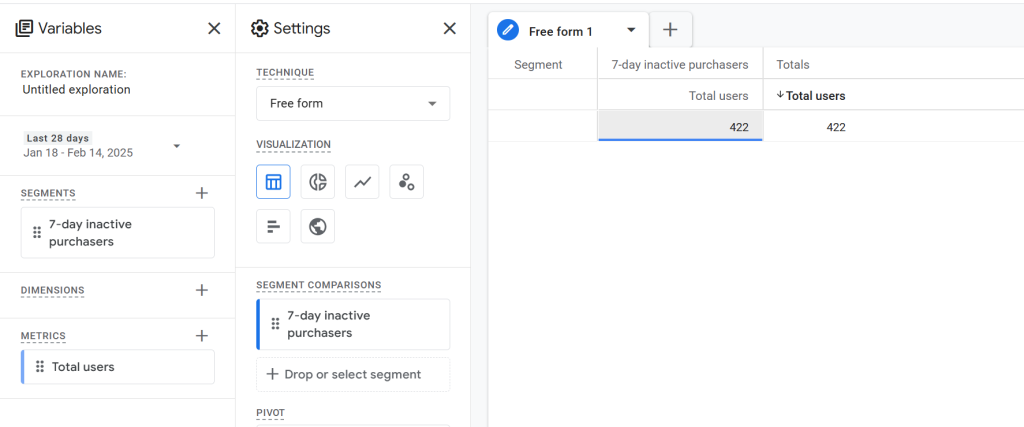
To get started, navigate to the “Explore” section in GA4 and create a new report.
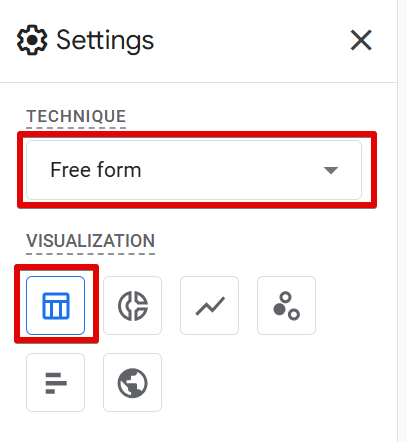
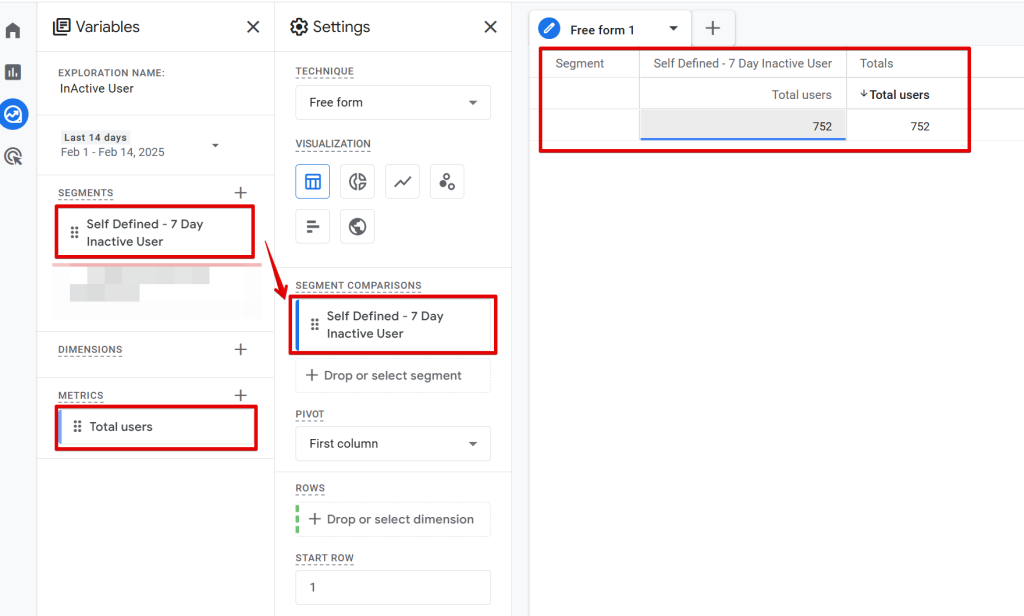
Choose “Free form” as the report type and set the visualization to “Table.” Then, select your preferred date range for the analysis.
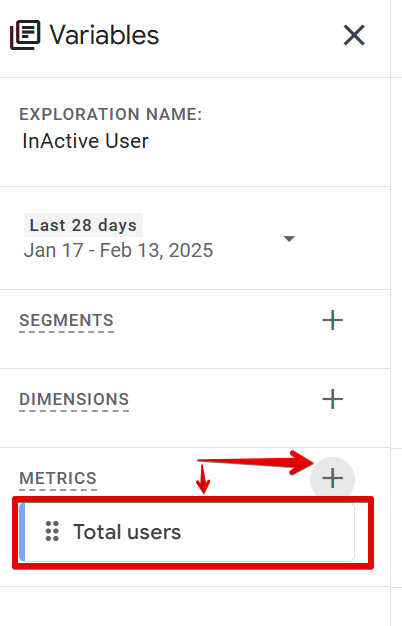
Ensure the “Total Users” metric is included in your report. If it’s missing, click the “+” icon to add it. Once added, drag the metric into the “Values” section or double-click it to place it automatically under the values section in the exploration settings tab.
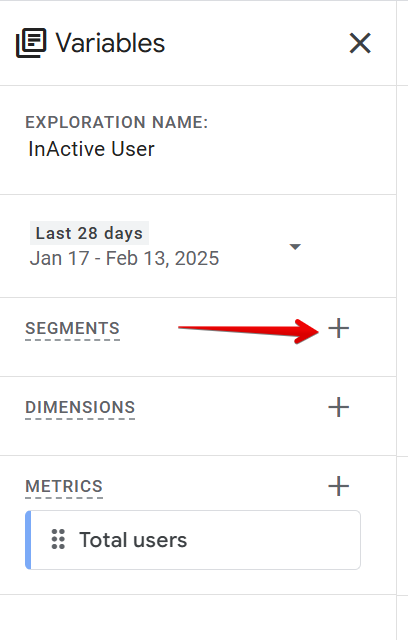
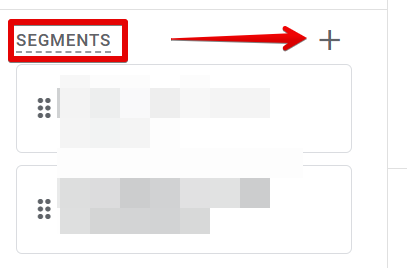
Next, create the necessary segments to answer your question. Click the “+” icon next to “Segments” to define a custom segment.
You’ll see a screen displaying the list of system-created and your own segments. Then, click on the “Create a new segment” button.
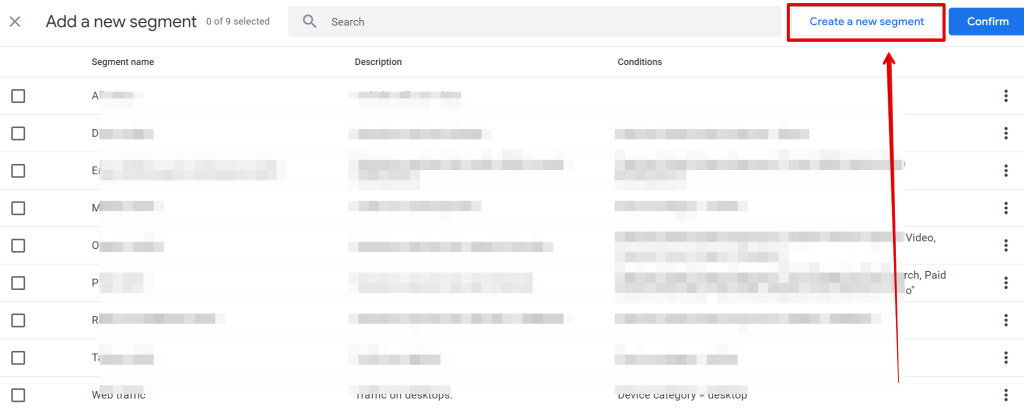
Don’t worry, as creating these segments is not technical, and I’ll guide you through the process for each question step by step.
Creating Segments for “N”-Day Inactive Users in GA4:
To analyze “N”-day inactive users, follow these steps to configure a custom segment:
Step 1: Check for Existing Templates
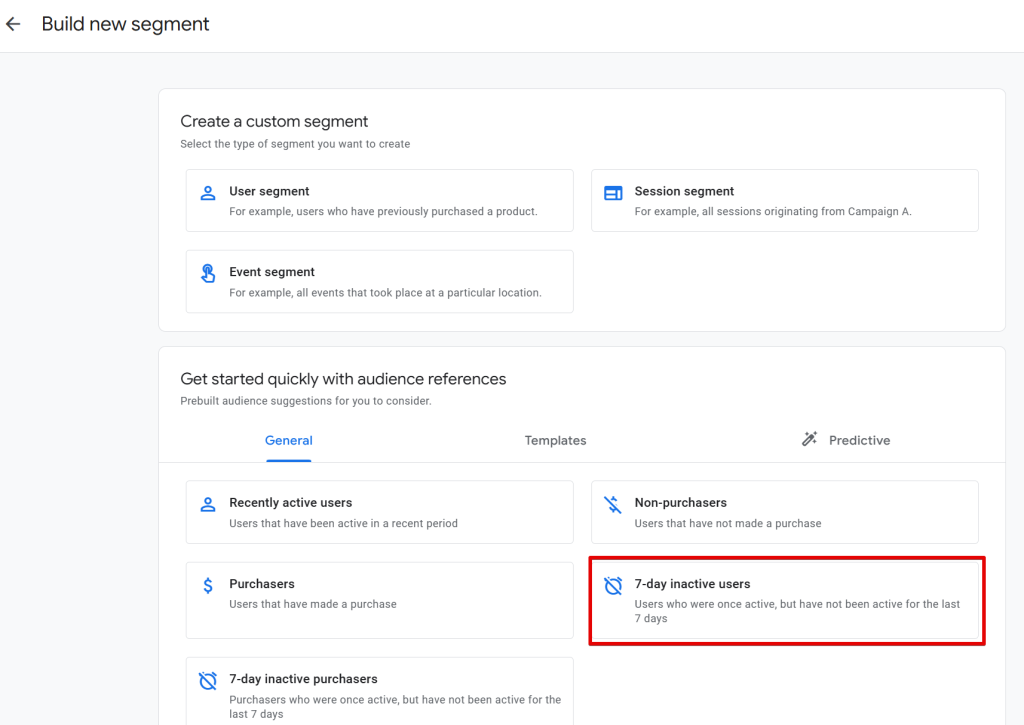
In the Segment Builder view, navigate to the “General” section and look for the “7-Day Inactive Users” segment template. If it’s available, simply click on it to use. However, if you can’t find it, don’t worry; I’ll guide you through creating one from scratch shortly.
After selecting the segment template, you can click the Apply button if you are okay with the template configuration.
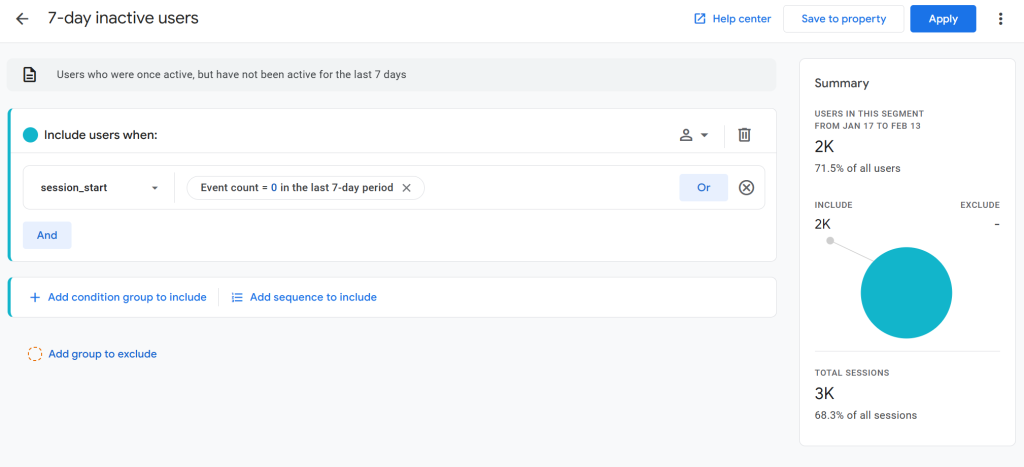
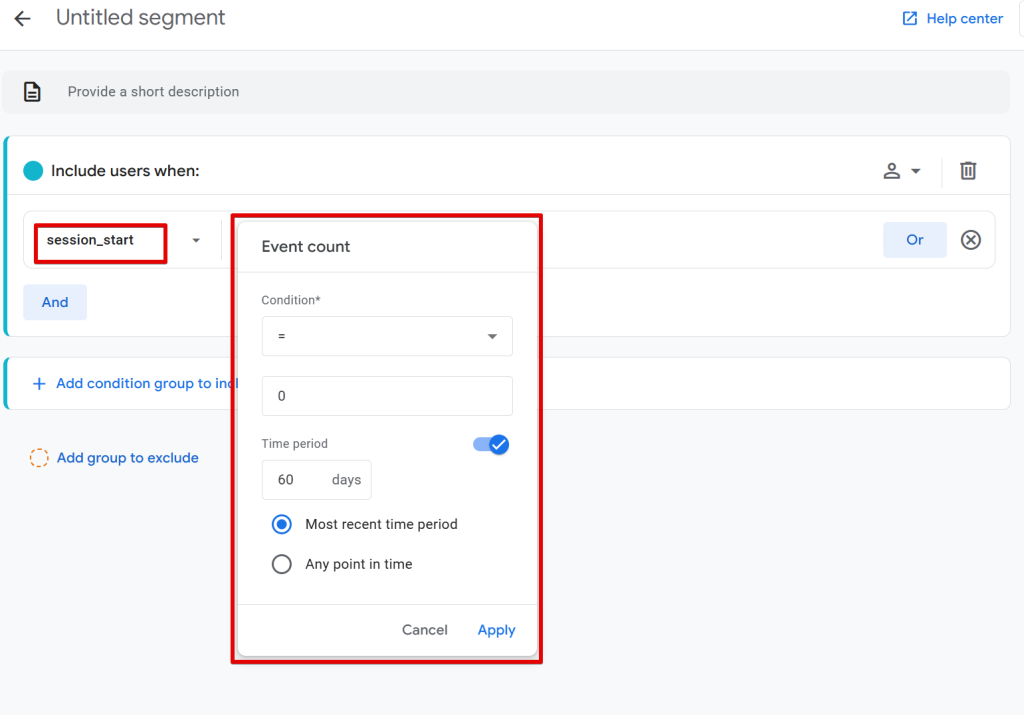
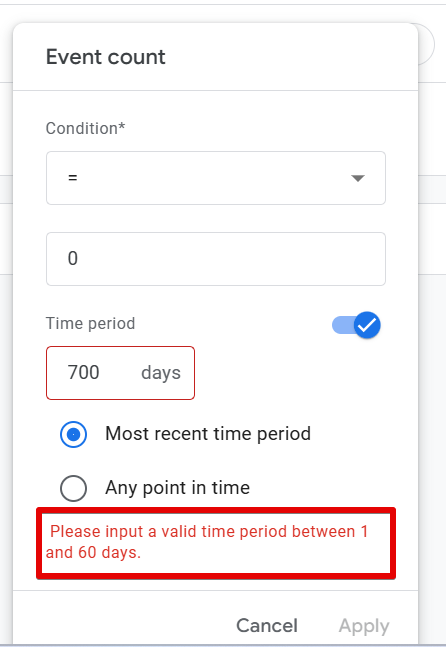
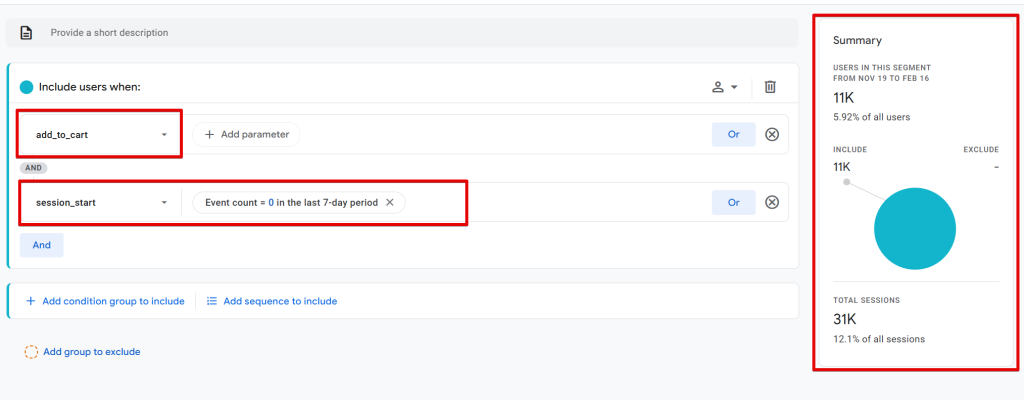
The segment configuration should include users who have not triggered the “session_start” event, where the event count is zero (0) and the specified time is a period of 7 days (or your preferred duration). Use the “Most recent time period” option to include users who currently meet the condition and exclude them once they no longer qualify.
Step 2: Configure the Segment
Once configured, you’ll have successfully created a GA4 segment of users who were previously active but have not been active for the last 7 days.
You can adjust the number of days based on your analysis needs. Note that GA4 has a limitation to look back to as far as the last 60 days.
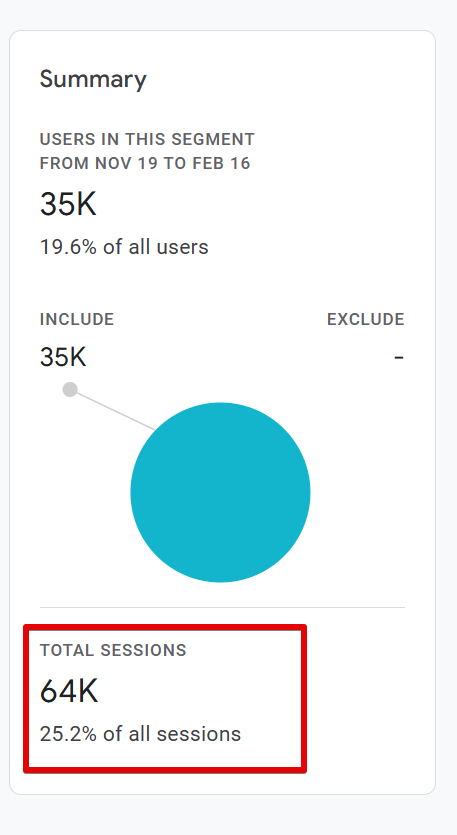
Step 3: Review the Summary Card
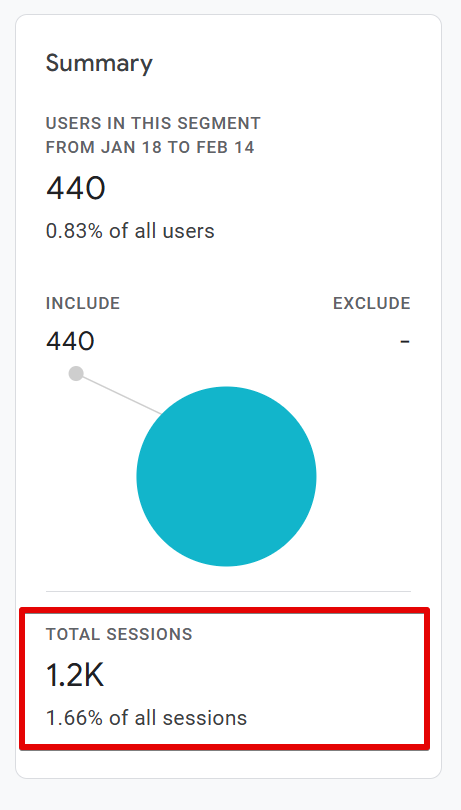
In the Segment Builder, the Summary Card on the right-hand side provides aggregated data about the segment, including:
- Number of users in the segment.
- Percentage of your total website users.
- Date range used for data aggregation.
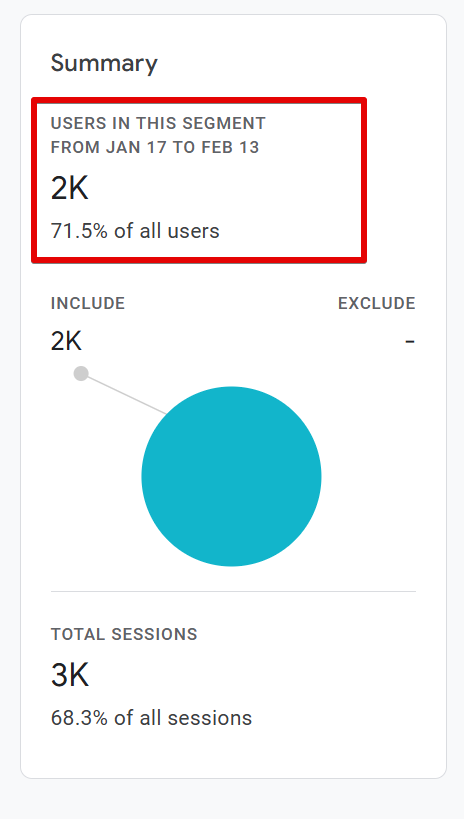
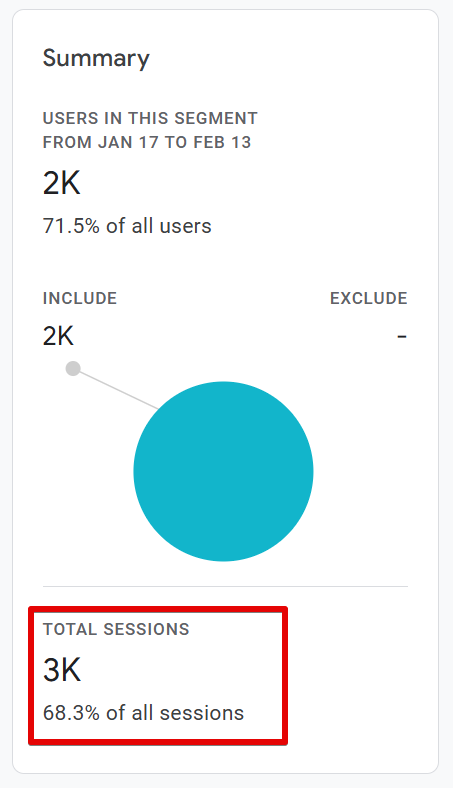
The “Summary Card” also displays the number of sessions these users had on your website and the percentage that represents your total sessions.
Step 4: Create a New Segment (if needed)
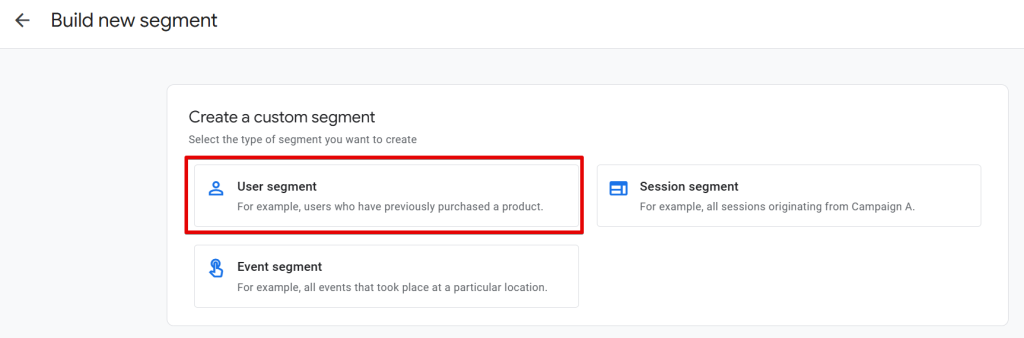
If you cannot find the template, create a new segment by selecting the “User” segment type in the Segment Builder.
Keep the condition scoping as “Across All Sessions”
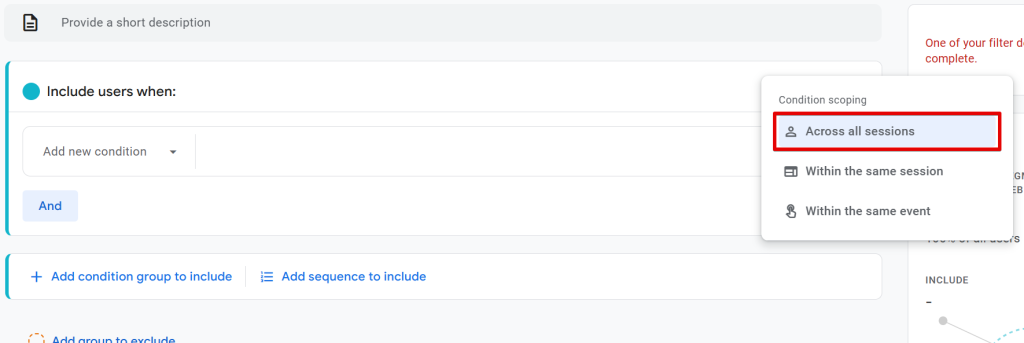
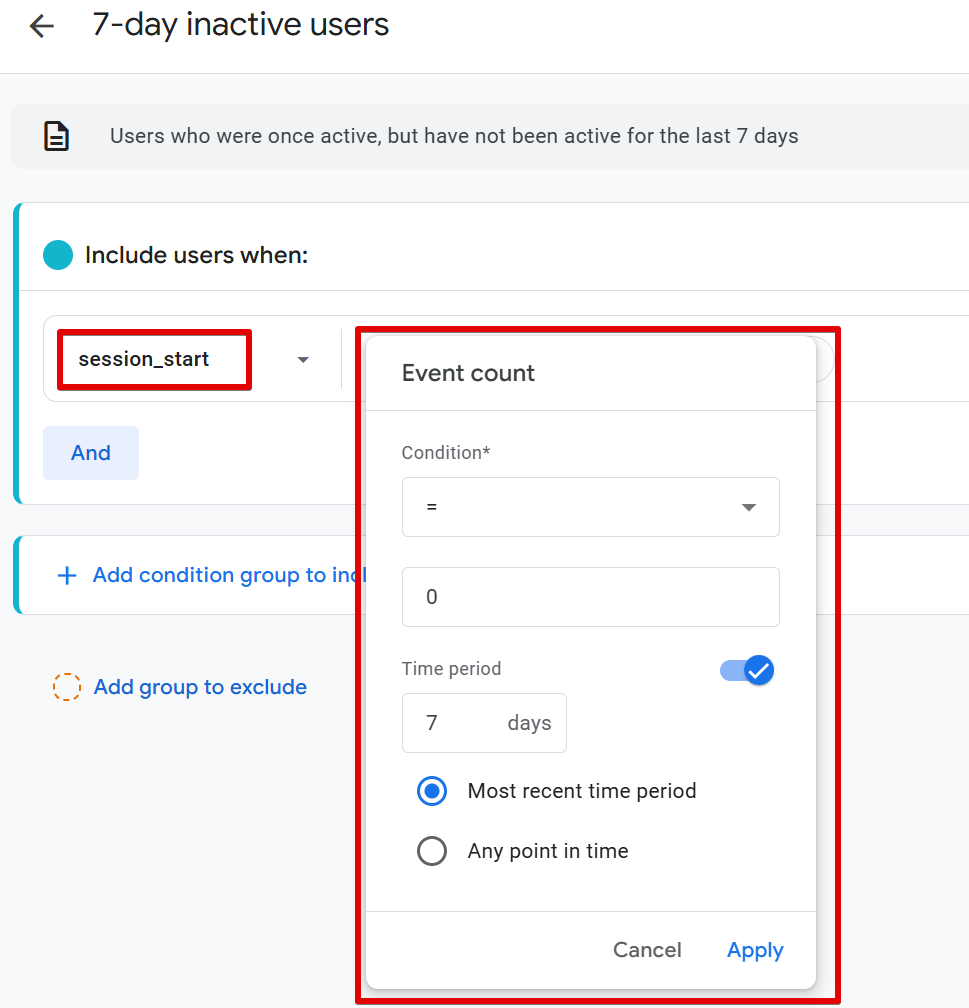
- Under Segment Configuration, choose the session_start event.
- Click Add Parameter, and under “Other,” select Event Count.
- Set the condition to equals zero (0).
- Enable the time period option and input your preferred number of days, with 60 days being the max.
- Change the time evaluation setting to “Most recent time period” to include only users who currently meet the condition.
- And click the “Apply” button.
Name your segment, save it, and apply it to your report. This will display the number of users who were active but have not returned within your specified “N” days.
However, it does not provide insights into the trends or patterns of this inactivity over time, which brings us to the next step.
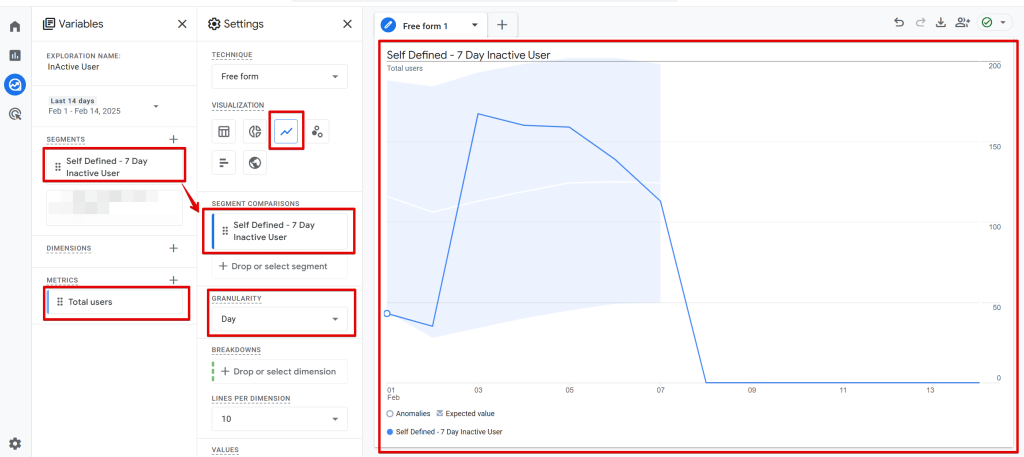
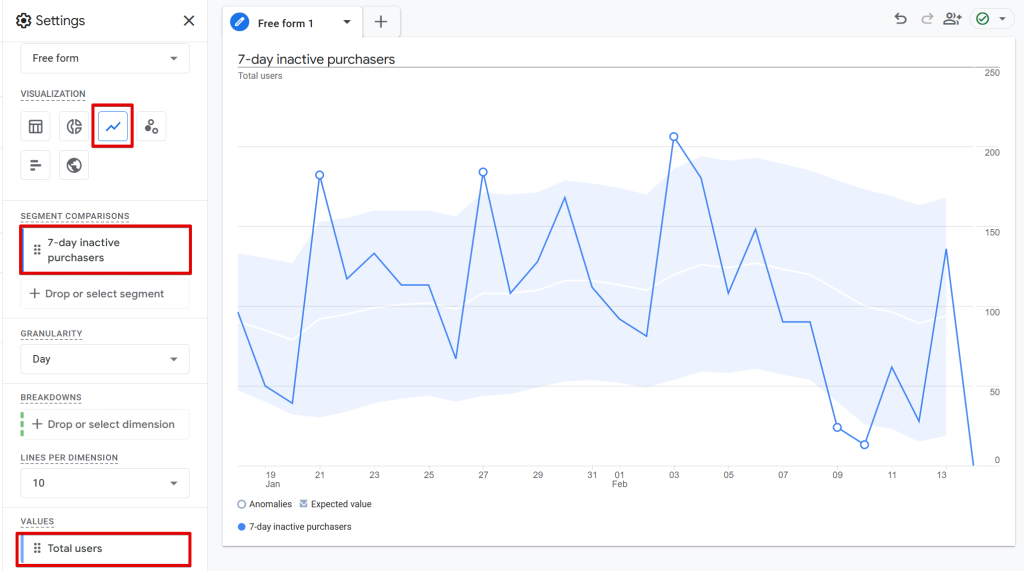
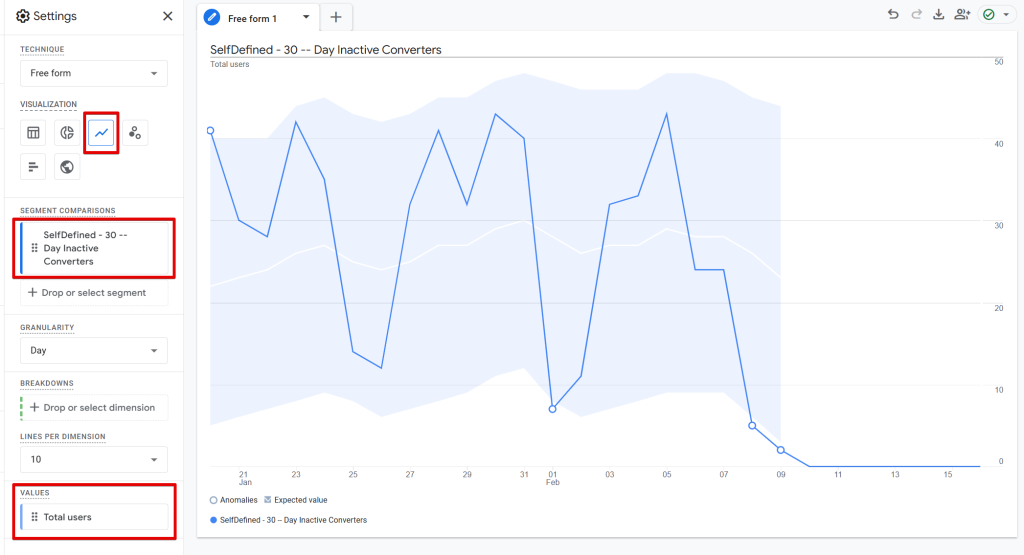
Step 5: Visualize Trends
Duplicate the report and switch the visualization to a Line Chart to observe trends. This helps you track whether the number of inactive users is increasing or decreasing over time.
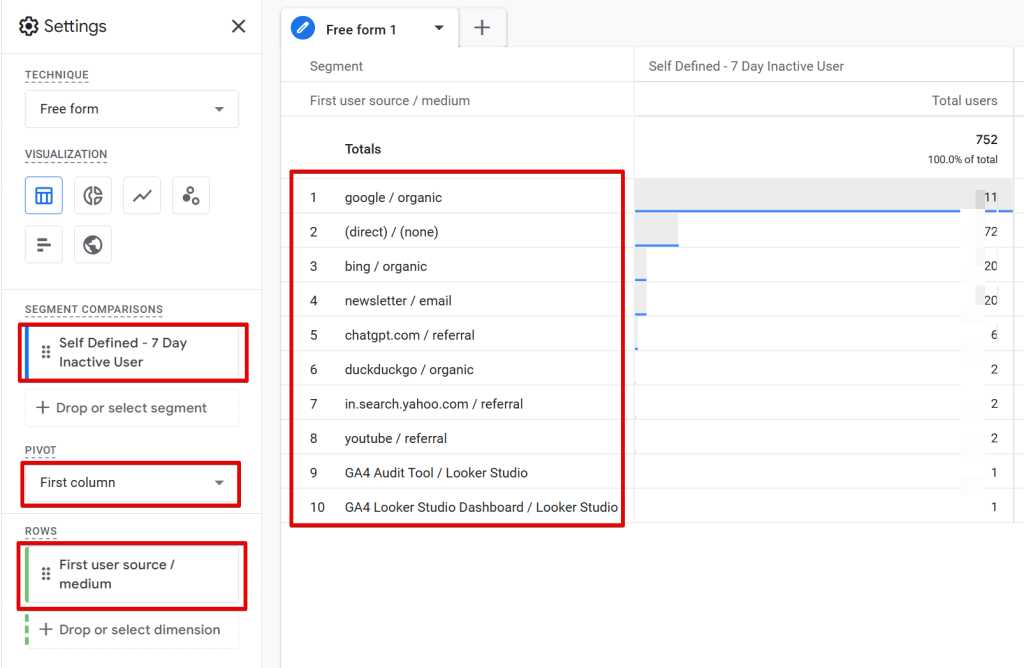
Step 6: Add Dimensions For Detailed Insight
For deeper insights, apply a meaningful dimension to break down the data, such as “First Traffic Source” or “Country”. Be cautious when adding dimensions to avoid overcomplicating the analysis.
By following these steps, you’ll effectively identify and analyze “N”-day inactive users in GA4, enabling you to make data-driven decisions to improve user retention and engagement.
Creating “N”-Day Inactive Purchasers in GA4:
Similar to the process for “N”-Day Inactive Users, you can create a segment for “N”-Day Inactive Purchasers; these are users who have made a purchase but have not been active for the past “N” days.
To create and apply this segment to your report, follow these steps:
Step 1: Create a New Segment
In the Explore section, click the “+” icon to create a new segment.
Select the “Create a new segment” in the next screen which takes you to the “Segment Builder Interface”.
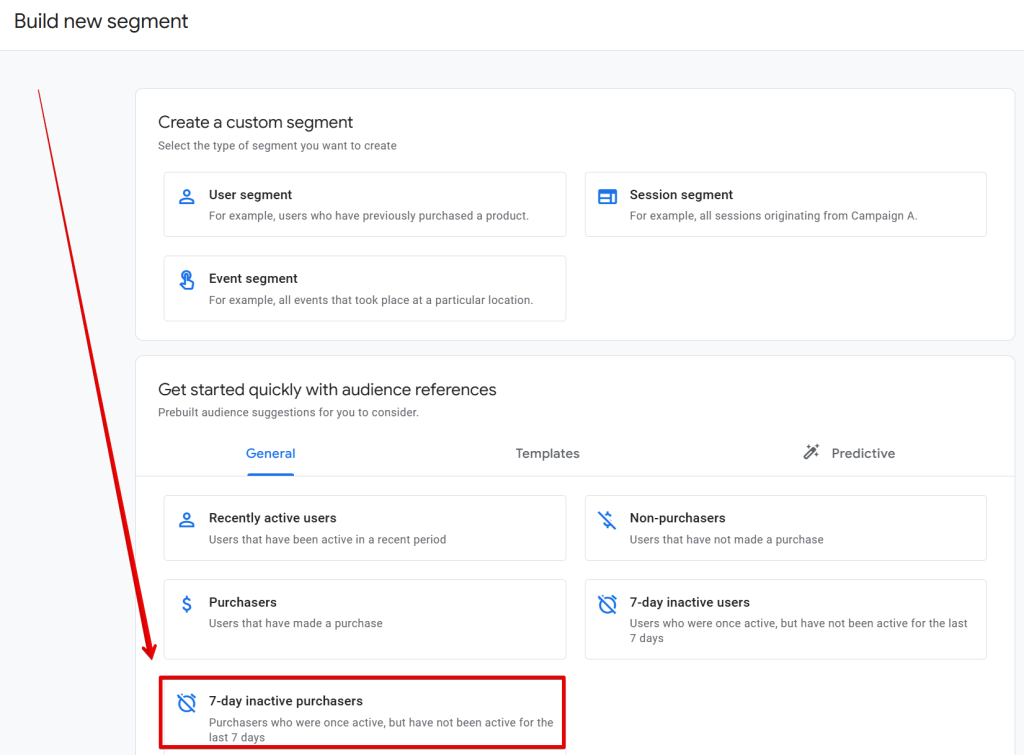
In the Segment Builder interface, look for the “7-Day Inactive Purchasers” template.
It can also be customized as needed. If you don’t see the template, don’t worry; I’ll show you how to create it from scratch.
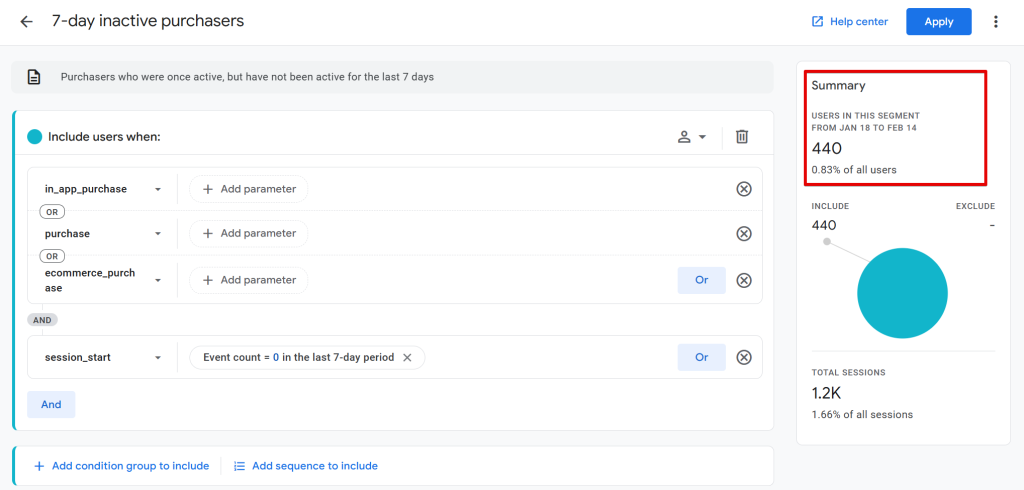
Step 2: Configure the Segment
Set the segment to include users who have performed one of the following Google Analytics transactional events:
- in_app_purchase
- purchase
- ecommerce_purchase
You can remove any event not relevant to your analysis.
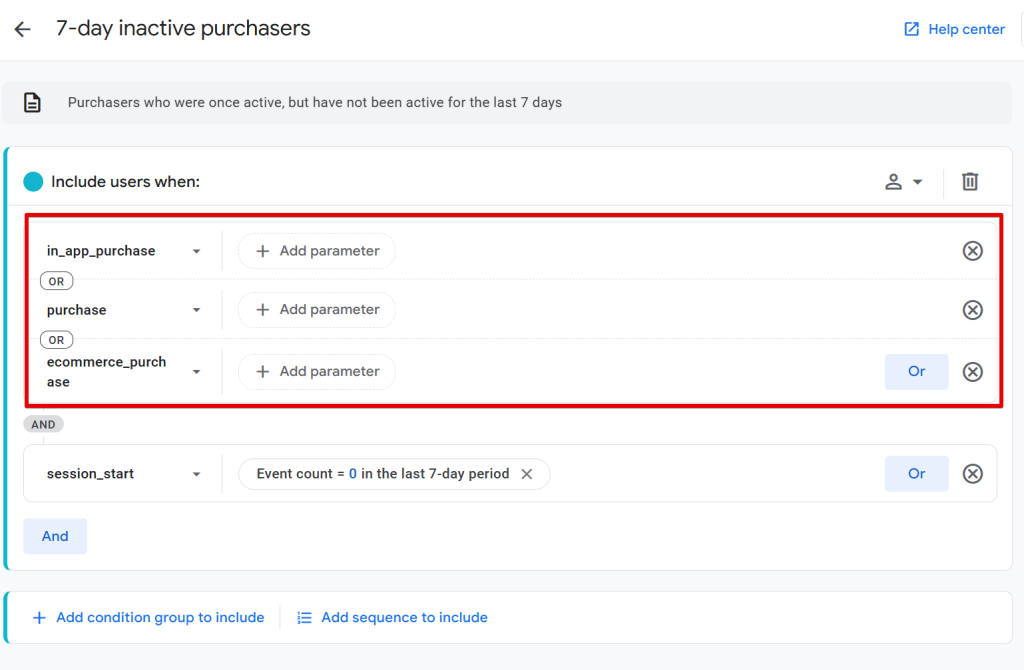
And users where the session_start event count equals zero (0) over the past 7 days, using the “Most recent time period” option for the inclusion time evaluation.
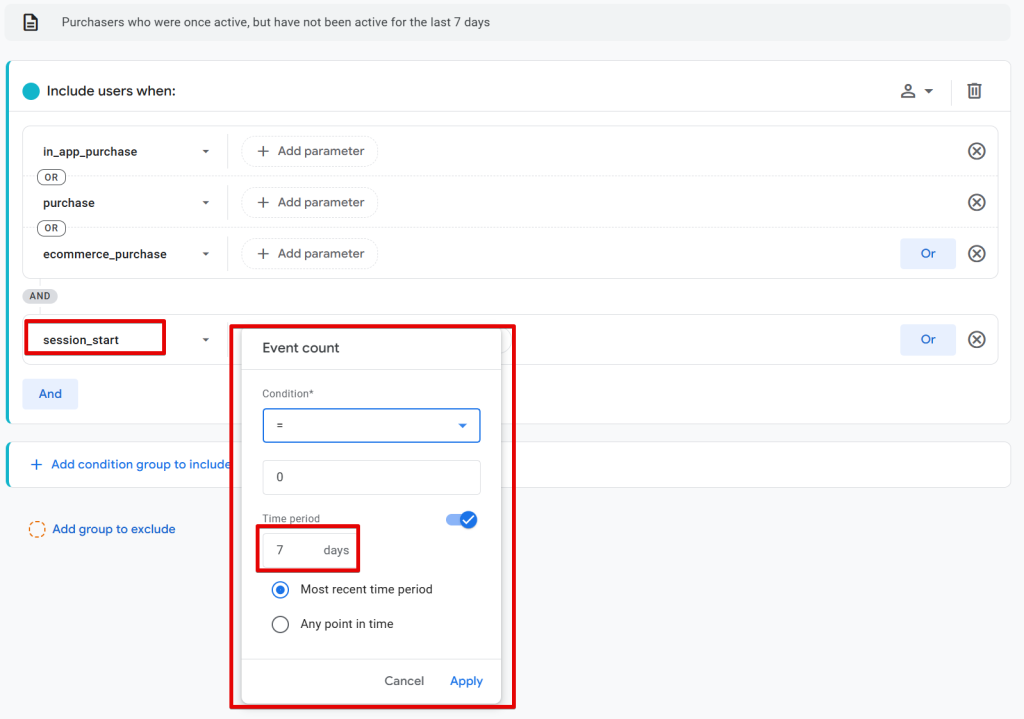
Step 3: Time-Period Customization
Remember that you can customize the number of days from 7 to any other duration (that doesn’t exceed 60 days) that suits your analysis, depending on the specific retention question you’re addressing.
Step 4: Review the Summary Card
In the segment, the Summary Card will display:
- The number of users in the segment.
- The percentage of your total website users.
- The date range used for calculations.
The card also shows the number of sessions these users have had and their percentage contribution to your total website sessions.
Step 5: Save and Apply the Segment
You can rename the segment for clarity or save it as is and apply it to your report.
Step 6: See The Trends
Additionally, you can use the data to identify trends in user behaviour, such as whether customers fail to revisit your website after their last purchase.
You can do this by switching to a time graph visualization, observing these trends, and determining if the inactivity is increasing or decreasing.
By following these steps, you can effectively identify and analyze “N”-Day Inactive Purchasers in GA4, enabling you to take proactive measures to re-engage these customers and improve retention.
If you’re interested in understanding repeat purchase behaviour, check out this article on how to utilize Google Analytics (GA4) cohorts for that purpose.
Creating a Segment for “N”-Day Inactive Converters in GA4:
The process for creating a segment for “N”-Day Inactive Converters is similar to the previous examples.
You can either use a segment template and update its configuration or create one from scratch. Here’s how:
Step 1: Create a New Segment
Choose the “User” segment type in the Segment Builder if you’re creating the segment from scratch.
Step 2: Configure the Segment
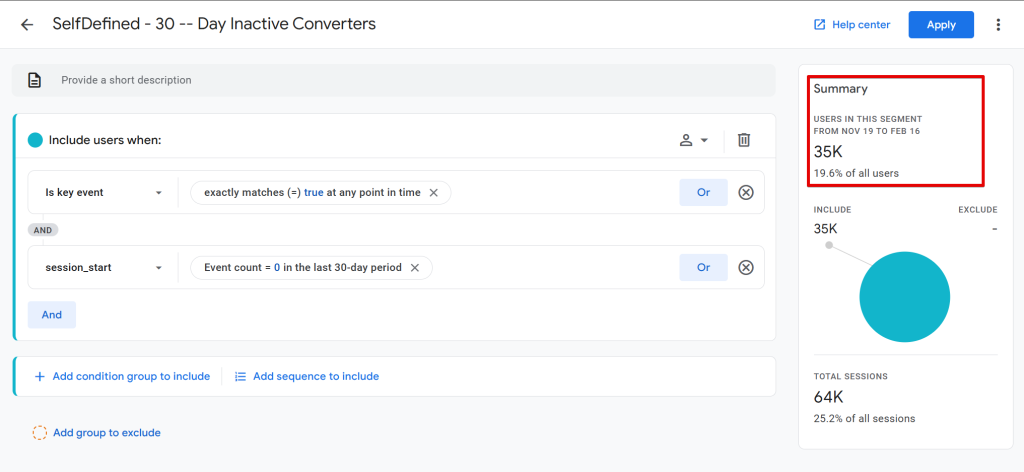
For this segment, which targets all conversion events, set the configuration as follows:
Ensure that the condition scoping is “Across All Sessions”
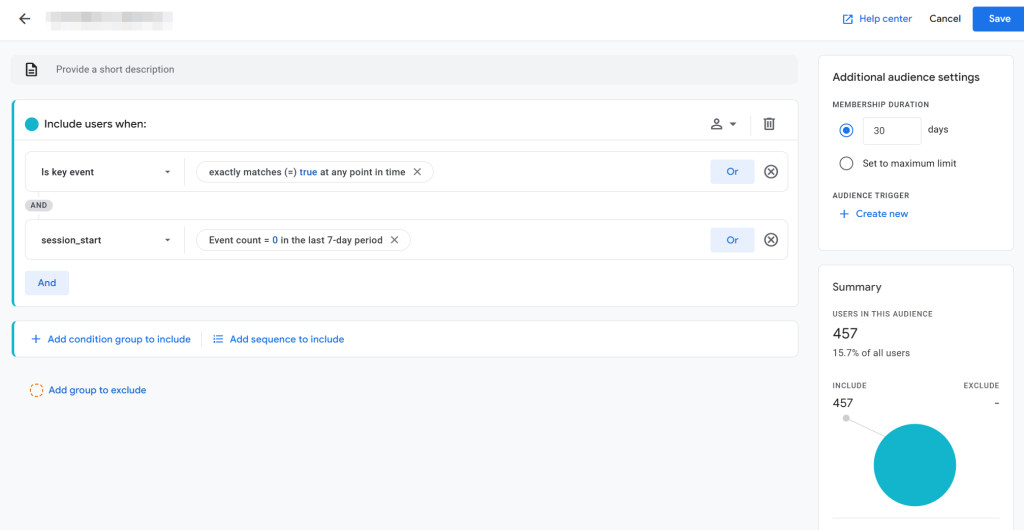
1. Include users where:
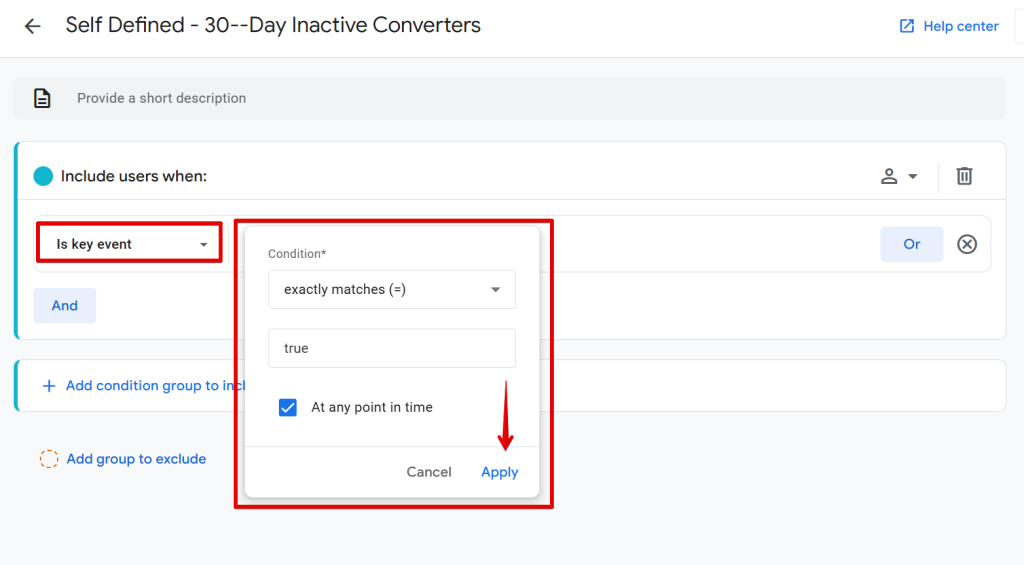
- “Is Key Event” equals true.
- To do this, click “Add Filter”, choose “Exactly Matches”, set the value to true, and check the box for “At any point in time”. This ensures you capture all converters, not just recent ones.
- And click apply.
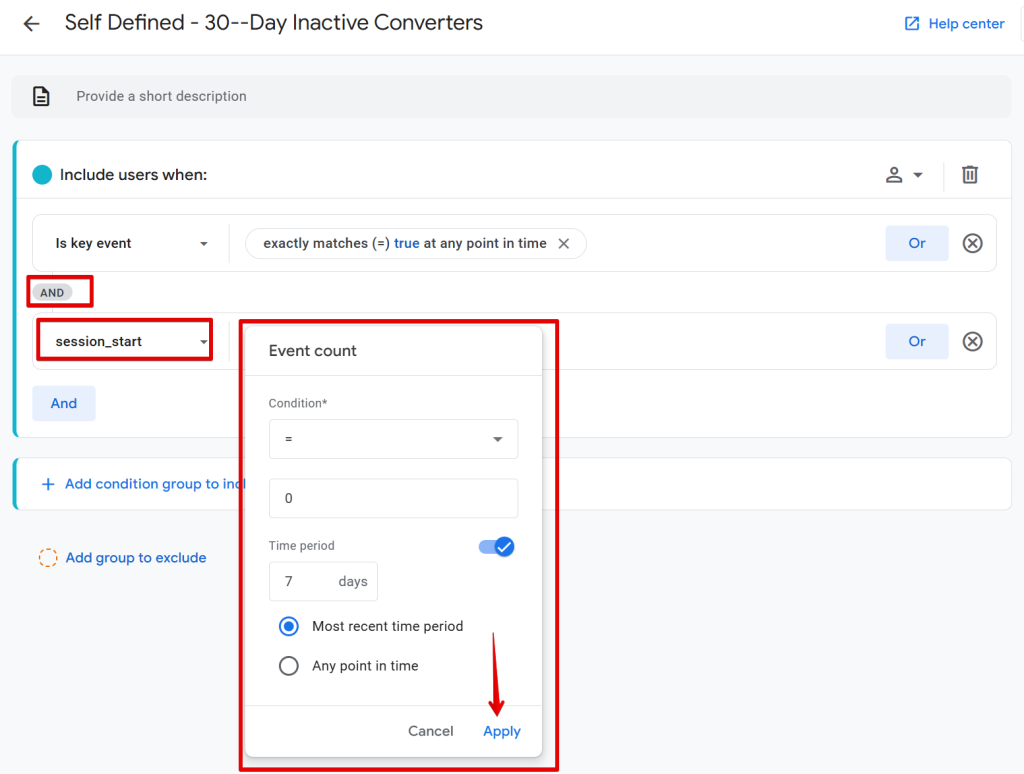
2. Add another condition by clicking “AND”:
- Select the session_start event.
- Click Add Parameter, then under “Other”, choose Event Count and set it to equals zero (0) within the last 7 days, using the “Most recent time period” for inclusion time evaluation.
- Click Apply
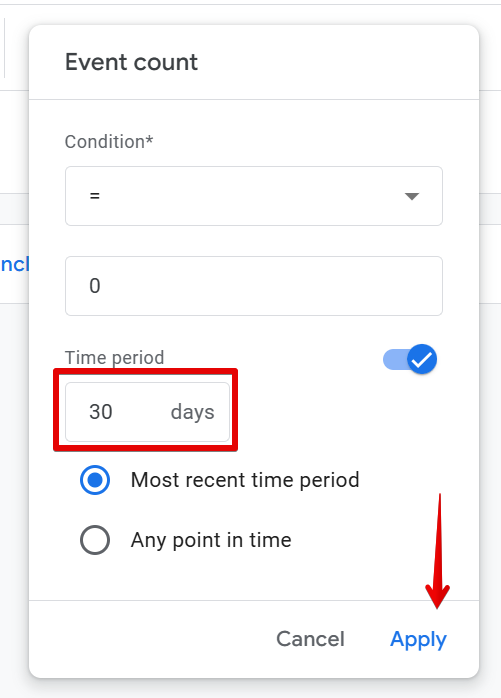
Step 3: Customize the Time-Period
Adjust the number of days (e.g., 7) to align with your specific measurement needs.
Step 4: Review the Summary Card
As always, you can always see the audience summary on the right-hand side, as the Summary Card will display:
- The number of users in the segment.
- The percentage of total website users.
- The date range for the calculations.
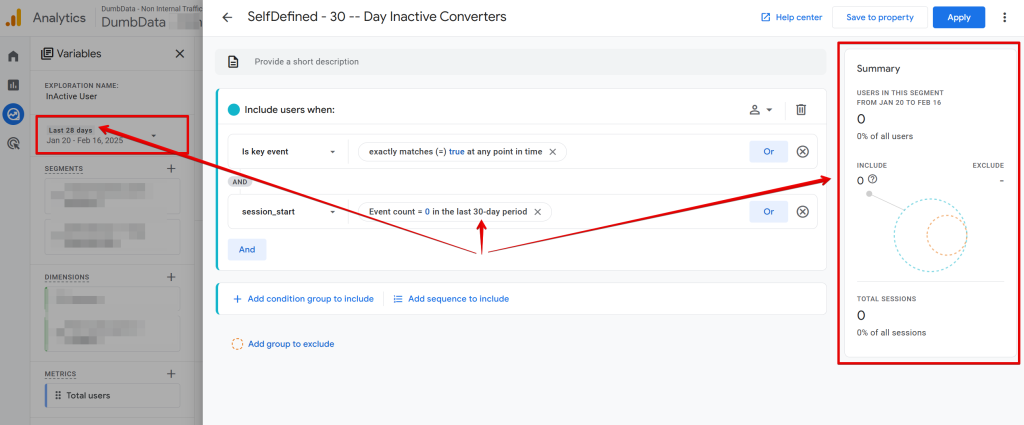
If the value appears as zero for you, don’t worry, you can still click “Apply.” The reason it shows zero in the summary card is due to the date range you selected in your GA4 exploration report while creating the segment.
Step 5: Save and Name the Segment
Name your segment something like “7-Day Inactive Converters” to clearly represent its purpose, capturing website converters who were active but have been inactive for the last 7 days.
You can also visualize the trend using a “line graph”, like I showed you earlier.
Segment for “N”-Day Inactivity After Performing a Specific GA4 Event
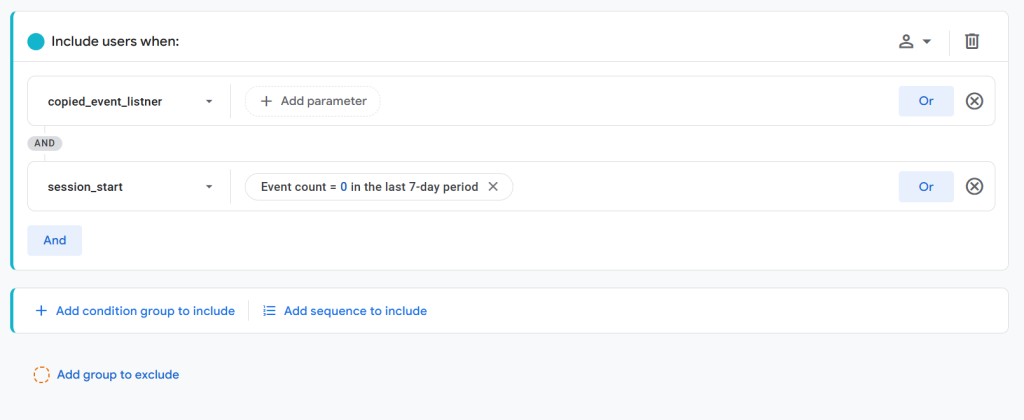
Using the same approach, we applied to inactive purchasers and converters; you can create a segment to identify users who completed a specific critical event (or events) and were once active but have not been active for the past “N” days. Here, “N” represents the number of days you specify.
For example, in the scenario below, I created a segment for users who triggered the “copied_event_listeners” event on the DumbData measurement resource hub and were active but have been inactive for the last 30 days.
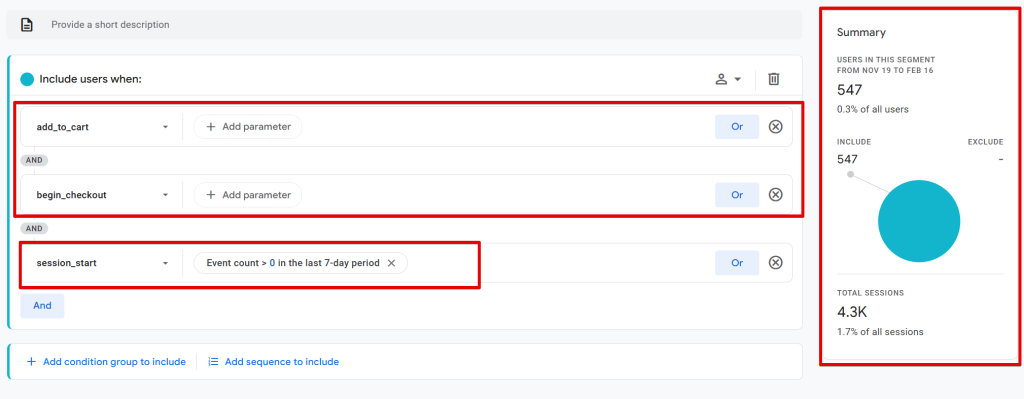
Another example below shows a configuration that includes users who performed two critical events. You can customize this to align with your business questions, so feel free to be creative and innovative!
This technique demonstrates how tracking “N”-day inactive users, converters, and purchasers can help answer critical business questions. However, note that GA4 limits time period analysis to a maximum of 60 days.
While there’s so much more you can do with this analysis and segmentation technique, I won’t go over them in detail here.
And, if you’re planning to activate these audience segments for retargeting ads, you’ll need to either turn these segments into audiences or create new ones.
It’s essential to ensure your GA4 property is linked to your Google Ads account to seamlessly stream these audiences into Google Ads for campaign use.
How to Activate “N”-Day Inactive Users, Purchasers, and Converters Audiences
For some businesses, simply understanding the numbers isn’t enough. They may also want to create a Google Analytics (GA4) audience for these users, enabling them to retarget this audience through Google Ads. If you’re wondering how to achieve this, here are the available methods:
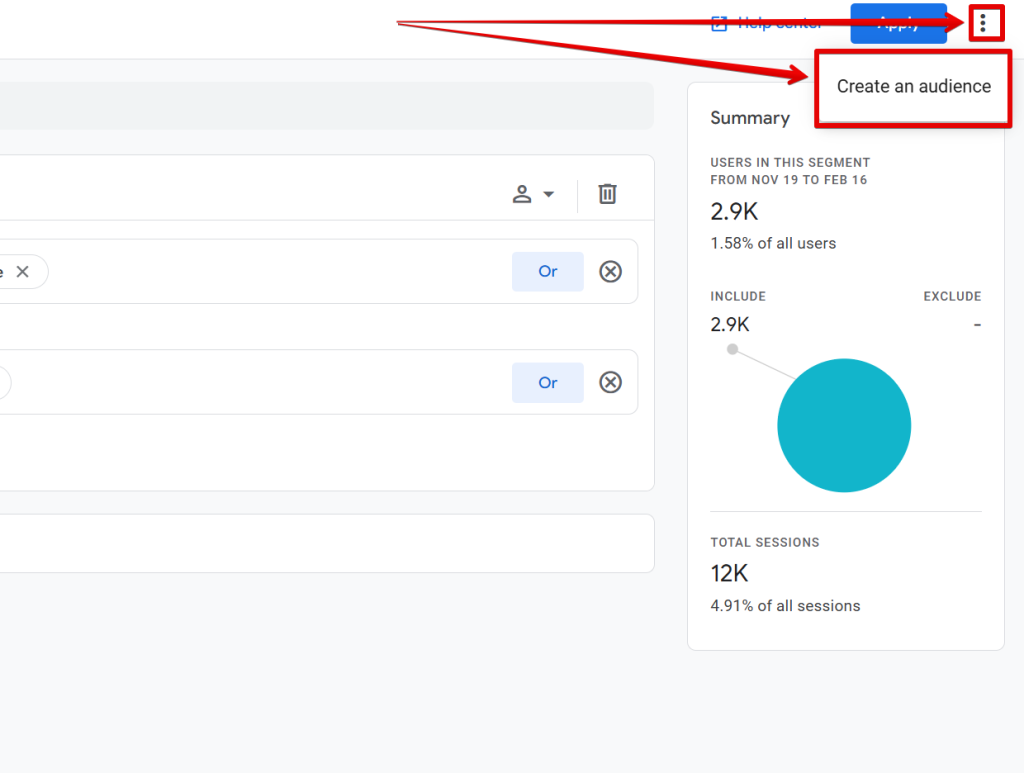
Method 1: Build an Audience Directly in the Segment Builder
Using this method is easier, and here are the steps involved:
- In the Segment Builder interface, click the three-dot menu and select the “Build an audience” option.
- Set your preferred membership duration.
- When you Save and Publish, an audience will automatically be created.
Method 2: Create an Audience via the GA4 Admin Interface
1. Navigate to the GA4 Admin section by clicking the gear icon.
2. Under the “Data Display” section, click on the “Audiences” tab to create a new audience.
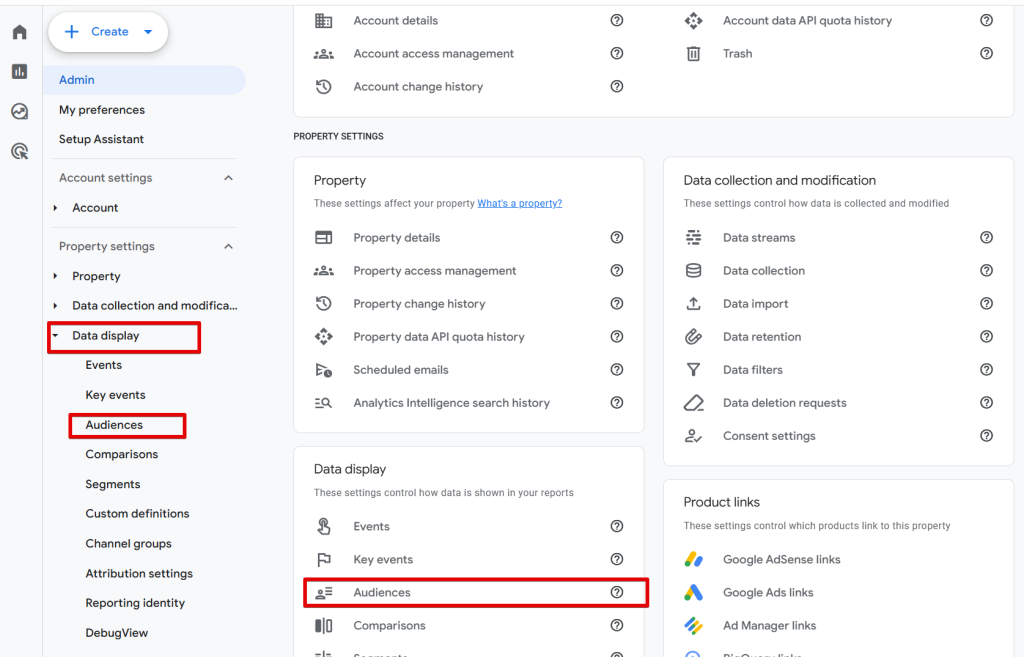
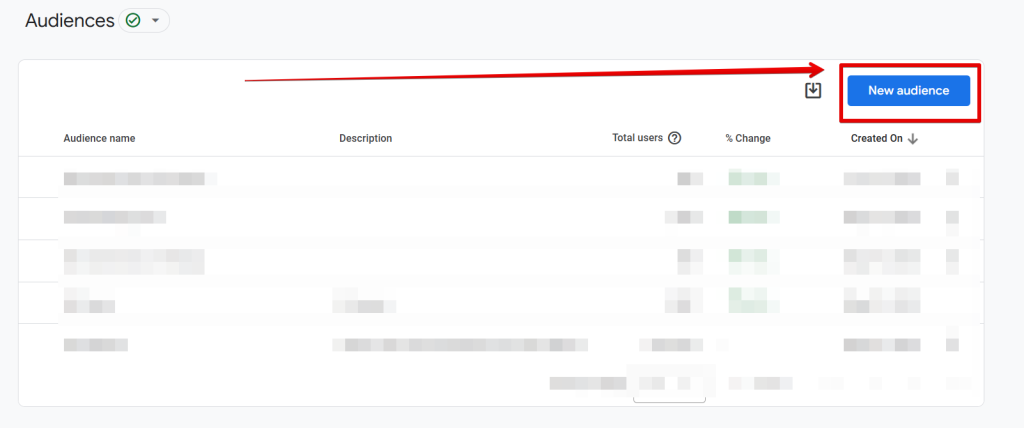
3. Select “New Audience” and either:
- Use an existing template (for inactive users or purchasers).
- Create a new audience from scratch using the same configuration detailed in the segmentation section of this guide.
Once created, the audience will begin populating in both Google Analytics and Google Ads, provided both tools are linked, and it meets the Google Ads audience remarketing requirements for your chosen campaign type and other audience policies.
Wrapping Things Up
I have covered not only how to create segments for “N”-day inactive website users, purchasers, or converters but also addressed unique use cases tailored to various business needs.
While there is 60 days period limitation in GA4 of how you can quantify inactive audiences, it remains highly practical for most business scenarios, as the goal is determining if there is any recency in the user interaction with your business.
We also covered how to activate these audiences in Google Ads, discussing two approaches:
- Turning segments into audiences directly.
- Creating GA4 audiences from scratch.
Now, I’d love to hear your thoughts! Are there any other innovative ways you can think of to use this reporting technique? If you have ideas or insights to add, feel free to share them. I’m always eager to learn.
If you need help with your analytics, you can reach out using the email or form on the Contact Us page. Until next time, happy measuring!