


This detailed guide will teach you how to create an audience performance report in Google Analytics (GA4).
An essential feature of any analytics tool is the capability to construct audiences and segment data, and Google Analytics (GA4) incorporates this functionality. In this article, we won’t be discussing how to create or activate audiences in GA4; instead, we’ll focus on developing a simple report that showcases the performance of the audiences you have created in GA4.
Although this article will be concise, let’s begin by briefly examining the concept of audiences in GA4.
What Are Audiences in Google Analytics?
Audiences in Analytics refer to groups of users that you categorize based on meaningful combinations of attributes such as demographics, geography, technology, acquisition, behaviour, and predictive factors that are relevant to your business.
The size of your created audiences will evolve as new user data is collected and processed by Google Analytics. Consequently, the memberships of users in audiences are periodically reevaluated to ensure they still meet the defined audience criteria. If the latest data indicates that users no longer satisfy the criteria, they are automatically removed from those audiences.
Having briefly explained the concept of audiences in GA4, let’s delve into the article’s core.
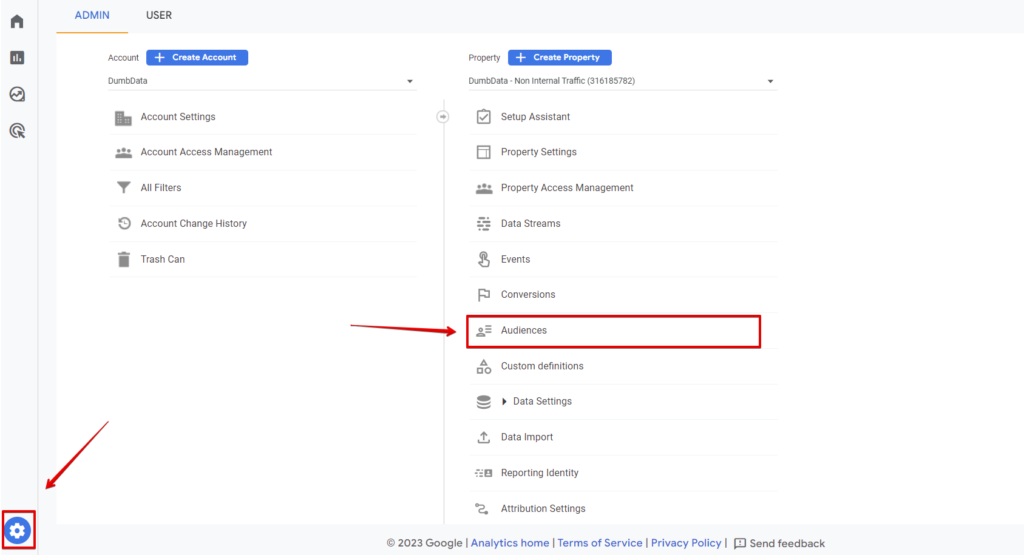
If you have already created audiences in GA4, you can find the dedicated report within Google Analytics. To access it, navigate to the admin section and click on the “Audiences” option under your GA4 property.
You should see an audience report similar to the one in the image below.
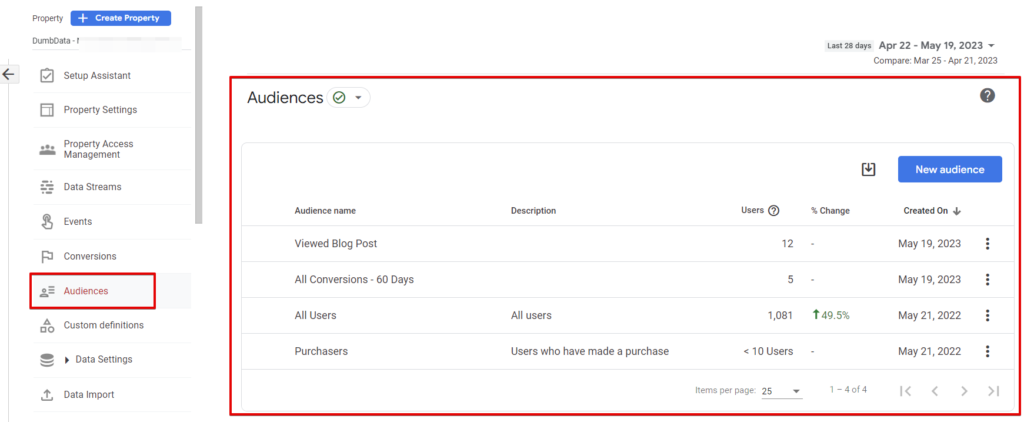
The report provides the following information:
- Audience name
- Audience description
- Audience size or estimates
- Percentage change in audience size
- Creation date of the audience
And with the option to download the table in a CSV format by clicking the download button icon at the top right section of the audience’s report.
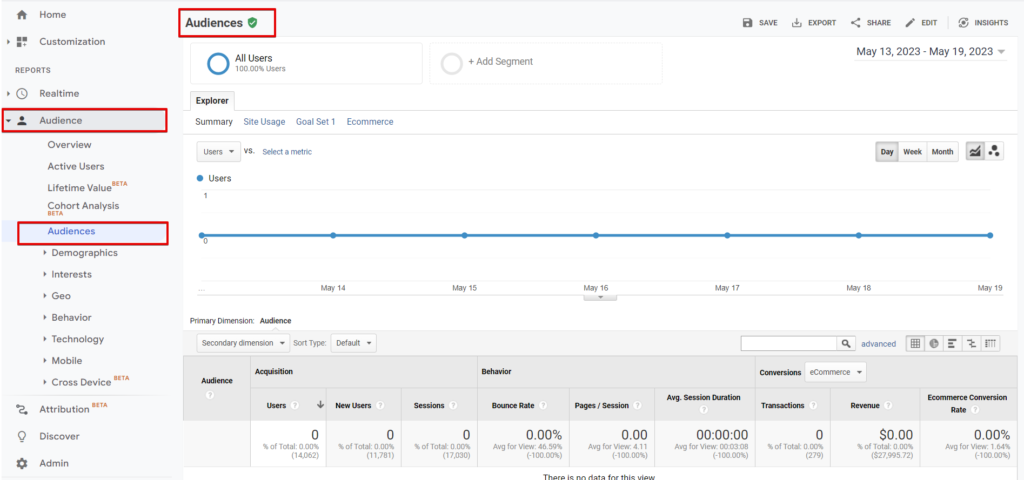
However, the report does not provide other performance metrics, such as the revenue generated by the audience, conversion events they have completed, engagement levels, or conversion rates. Unlike the previous version of Google Analytics (Universal Analytics), where a report showcasing different audience performances existed, GA4 does not offer this specific report.
In GA4, we no longer need to decide where the audience gets published. The audience data is readily available within GA4 and is seamlessly streamed to our ads platform if Google Signals is enabled, GA4 and Google Ads are linked, and the “Personalized Advertising” option is enabled, which is the default setting.
The question that arises is how to effectively report on the performance of the audiences created in GA4.
In GA4, we have two options for achieving this: incorporating the audiences as reports in the standard reports section or utilizing the exploration reports.
I would highly recommend using the standard reports as they are easily accessible to stakeholders and team members once they are in GA4. Furthermore, if you require in-depth analysis beyond the capabilities of the standard reports, you can also utilize the exploration reports.
In the following sections, I will guide you through reporting on audience performance using both the standard and exploration reports.
Building An Audience Performance Detailed Reports In Google Analytics 4 (GA4)
To begin creating the GA4 audiences performance report, follow these steps:
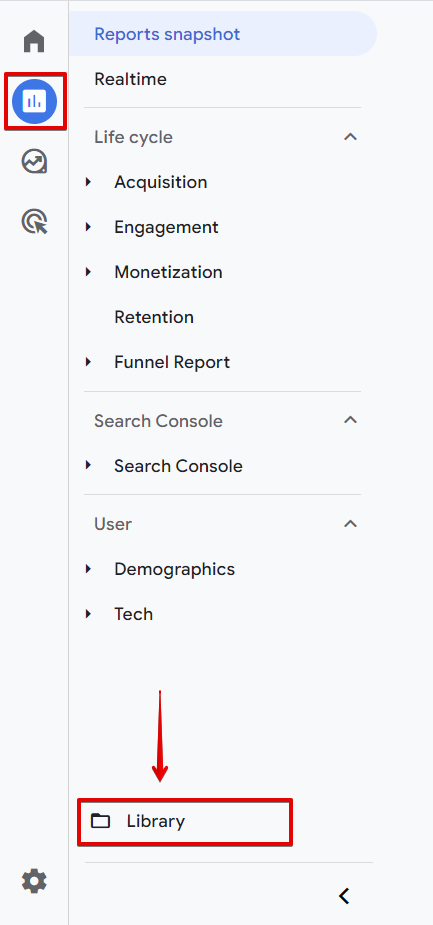
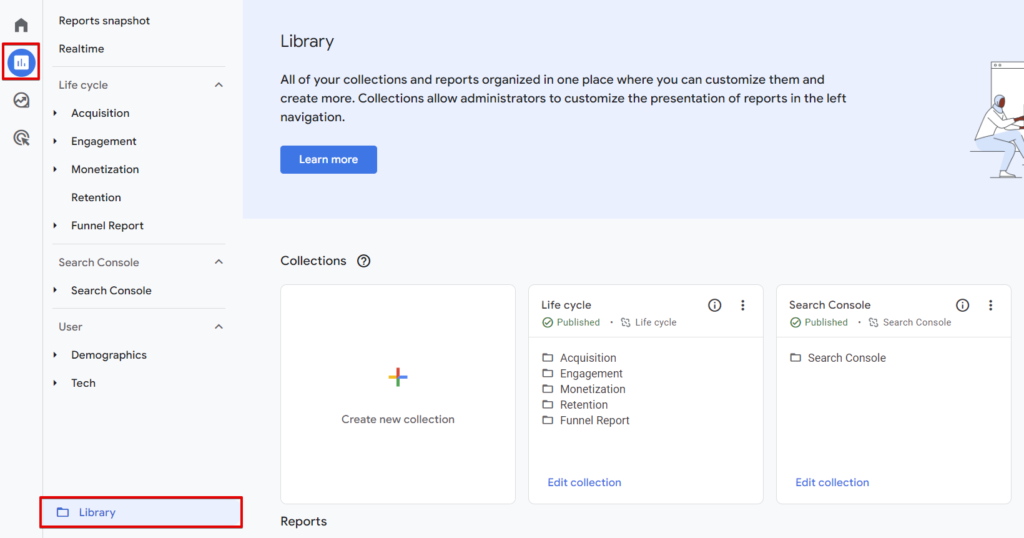
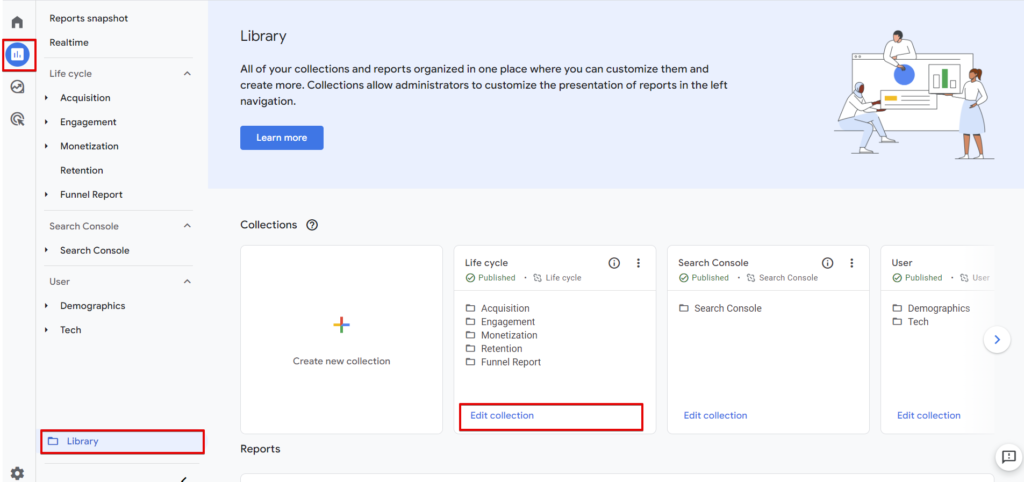
- Access the “Reports” section in your GA4 user interface (UI).
- In the submenu, select the “Library” option. This action will open a new interface.
- Within the new interface, navigate to the “Reports” section of the Library.
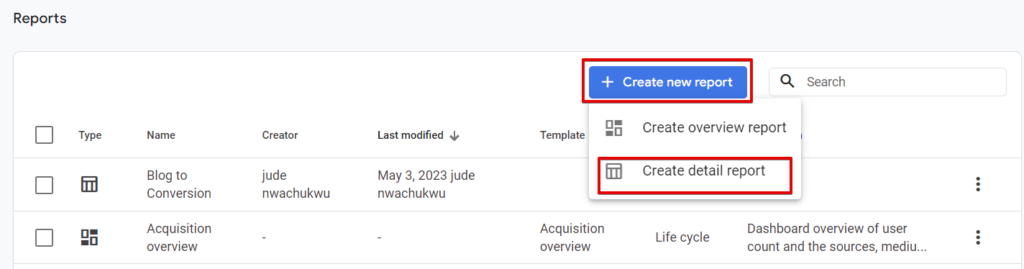
- Click on the blue “Create Report” button and choose the “Create Detail Report” option.
- A modal will appear. Select the “Blank Canvas” option.
- This selection will open a new interface where we can start building the GA4 audiences’ performance report.
Navigate to “Reports” and click the “Library” option.
Under the reports section, click “Create New Report” and choose “Create Detail Report” as your report type.
Choose the blank canvas option.
To configure the GA4 audiences performance report, follow these steps:
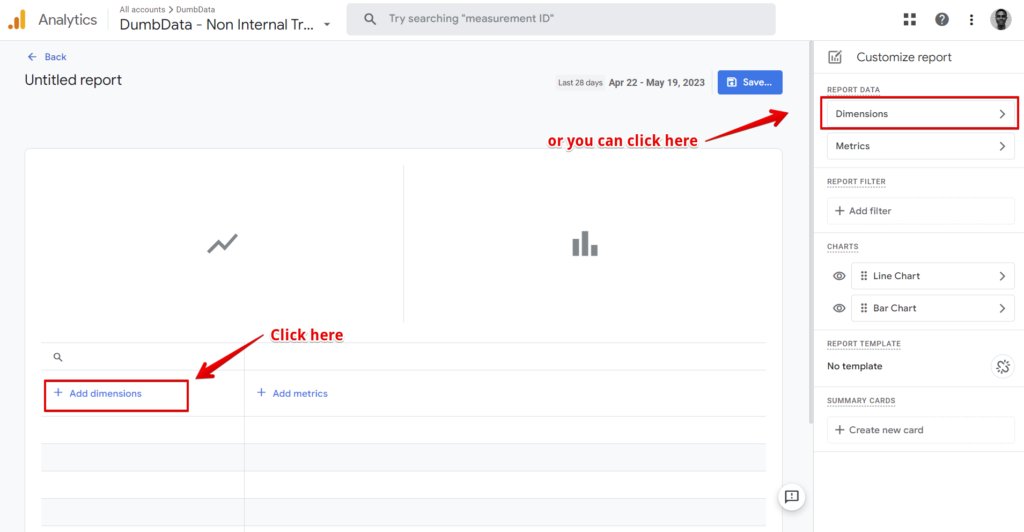
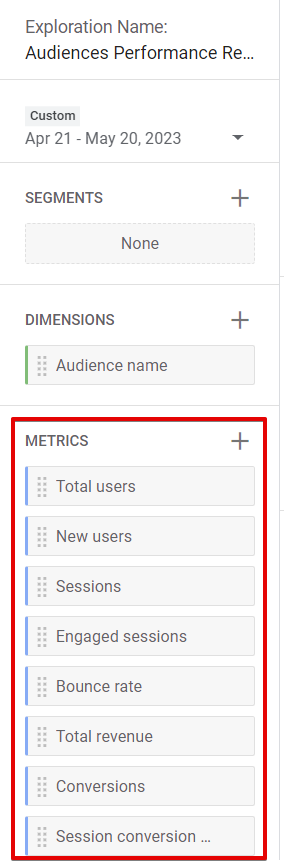
1. To select “Audience Name” as your dimension, click the plus icon labelled “Add Dimension” or choose the “Dimensions” option under “Report Data”. After which, you click the apply button to add it to your table.
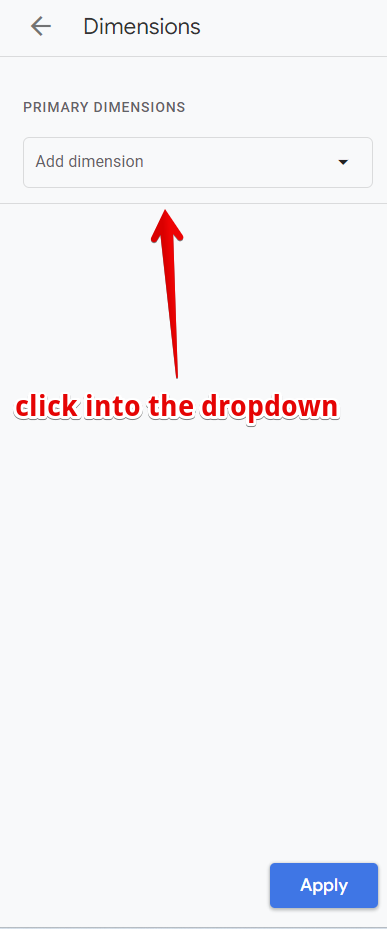
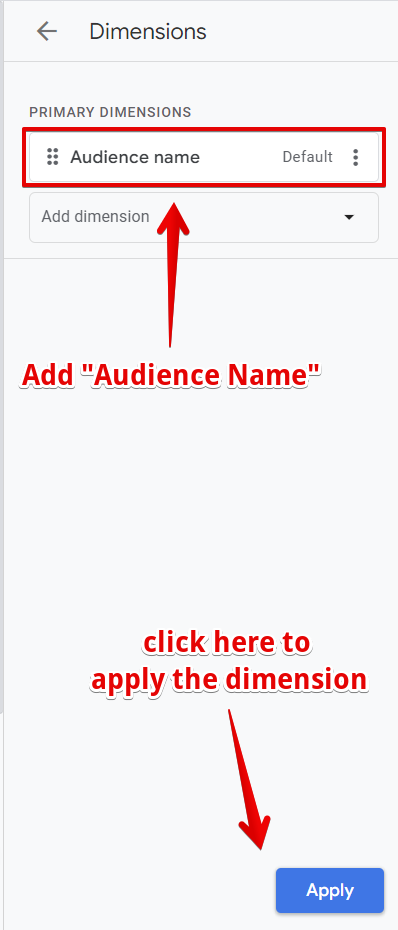
Click into the dimension dropdown to select “Audience Name” as a dimension that should be added to the report.
After you’ve added the dimension, click the “Apply” button to add the dimension to your report.
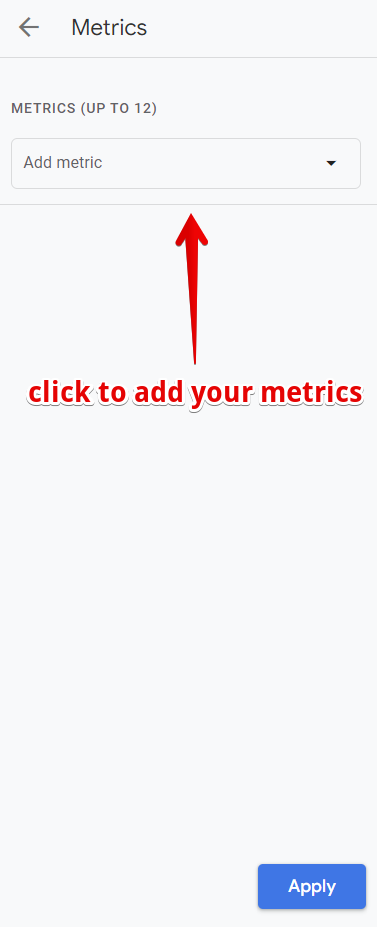
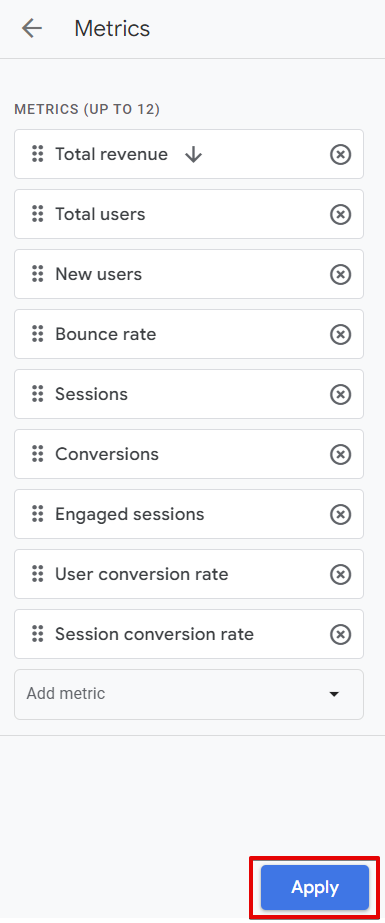
2. the choice of metrics depends on the performance indicators relevant to the “Audience Name” dimension. Similar to selecting the “Audience Name” dimension, click the plus icon labelled “Add Metrics” or choose the “Metrics” option under “Report Data”. You can then add the desired metrics you want to include in your report. In this tutorial, I’ll add the following metrics:
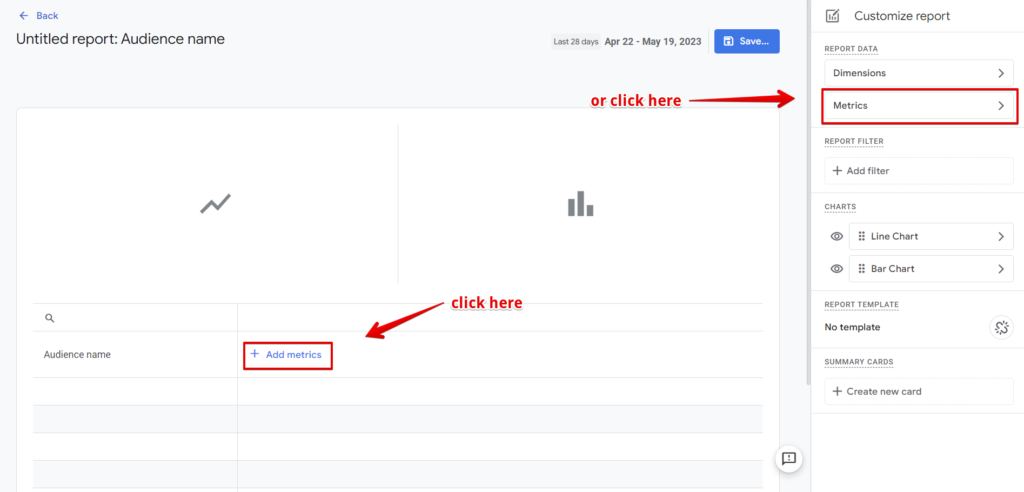
Click on the metrics dropdown to choose metrics that are relevant to you.
- Total Revenue
- Total Users
- New Users
- Bounce Rate
- Sessions
- Conversions
- Engaged Sessions
- Session Conversion Rate
- User Conversion Rate
After selecting your metrics, click the blue “Apply” button to add the metrics to your audience performance detailed report.
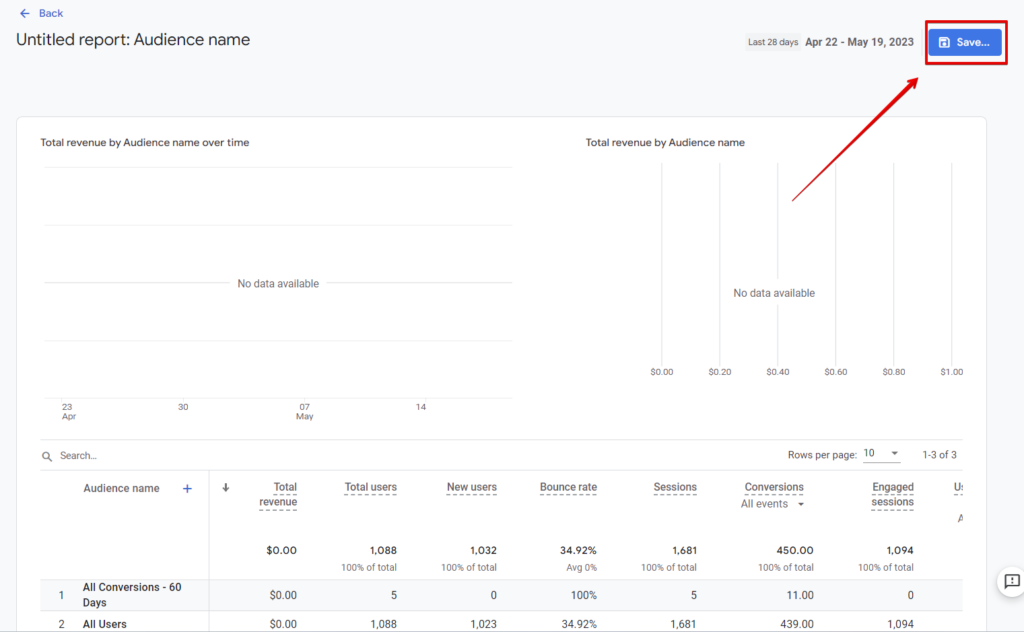
3. After you have added all the desired metrics, you can customize the detailed report summary card optionally.
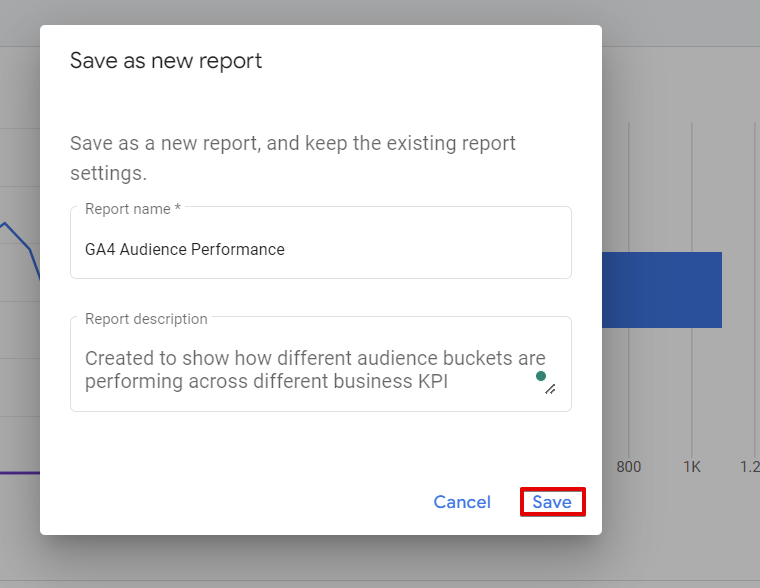
If you are satisfied with the configuration, click the blue “Save” button. You will get prompted to provide a report name and an optional description. After inputting the details, click the “Save” button.
Input your report name and an optional description.
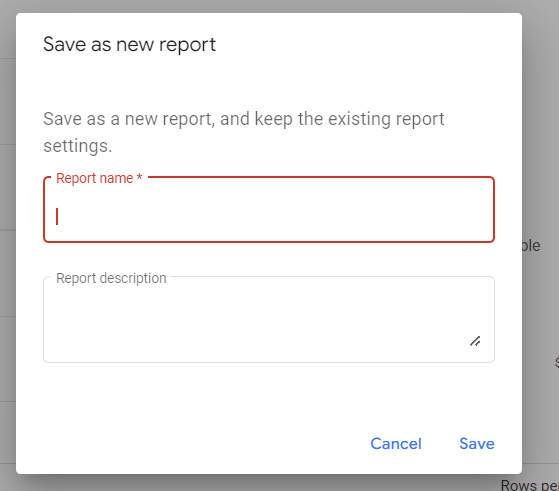
Click the save button.
After following the steps outlined above, you now have a comprehensive guide on creating and saving the GA4 audiences’ performance report with your desired dimensions and metrics. The next step is to add this report to the list of available reports in the standard reports section.
To include the GA4 audience performance report in your standard reports list, follow these steps:
1. Navigate to the report “Library” collection.
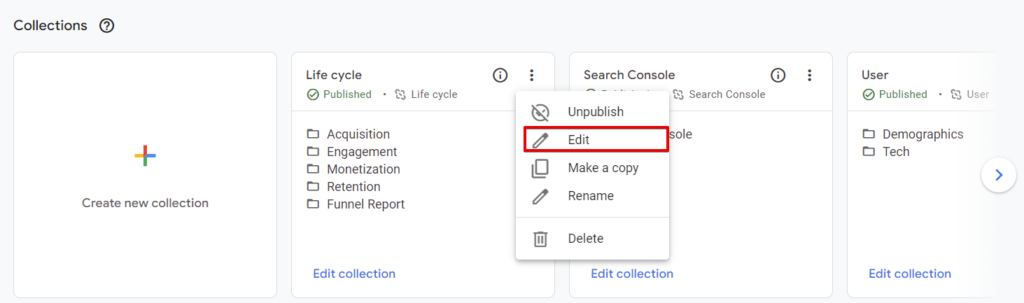
2. Choose the appropriate collection where you want to add the report. Then, click the “Edit Collection” button or the three-dotted icon and select “Edit”. In my case, I will choose to edit the “Life Cycle” collection.
Alternatively, you can click the three-dotted menu and select the “edit” option.
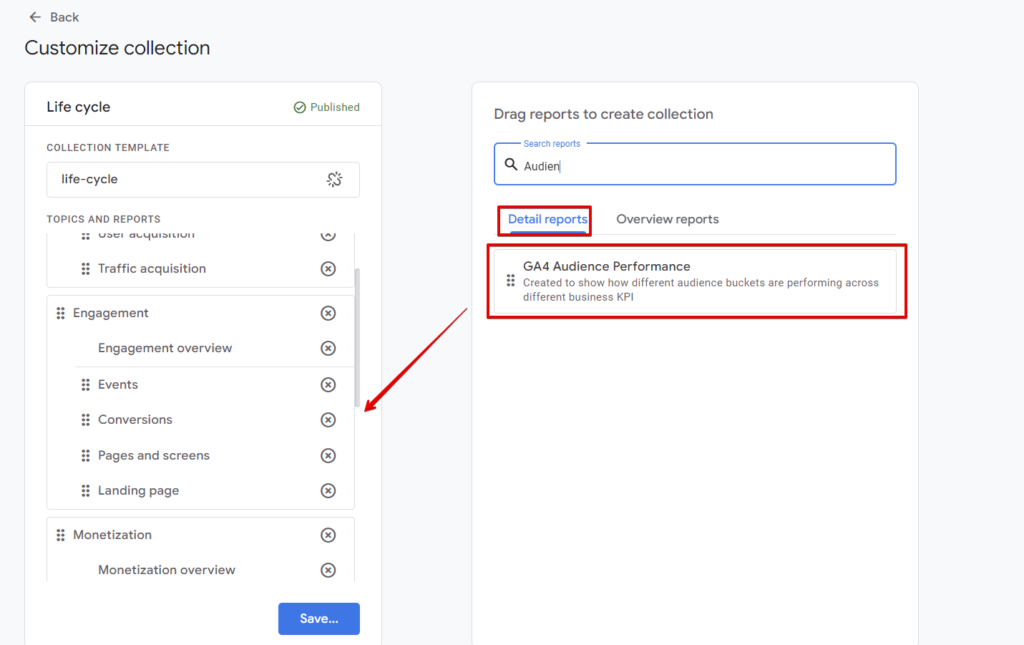
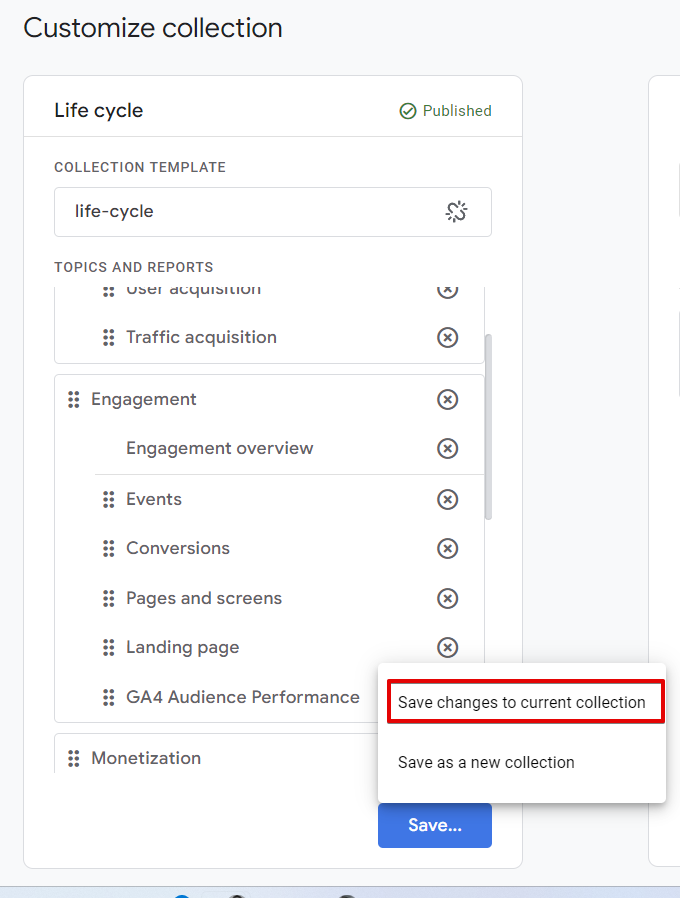
3. Drag the GA4 audience performance detailed report to your desired “Topic” within the collection. Alternatively, you can create a new topic specifically for this report. For example, in this article, I will add it to the “Engagement Topic”.
After dragging the “Audience Performance” detailed report to the “Engagement” topic under the “Life Cycle” Collection, click the “Save” button.
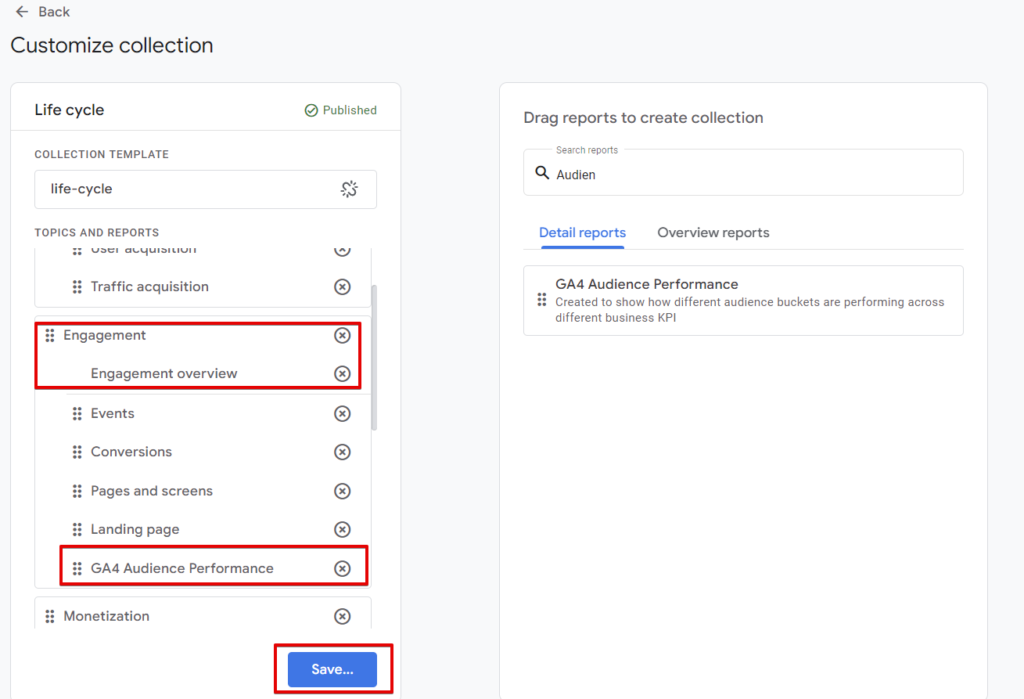
4. Once you have placed the report in the desired topic, click the “Save” button to publish it for all users of that GA4 property.
These steps will successfully add the GA4 audience performance report to your standard reports list. It will be accessible to all users of the GA4 property within the specified collection and topic.
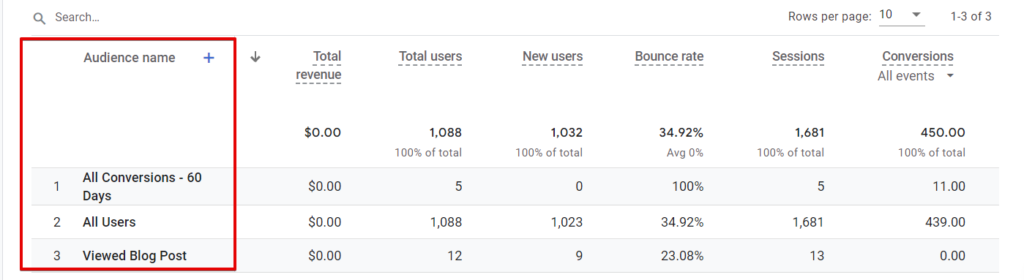
After you’ve made the publish, it should be easy to find the report when you navigate to the “Reports” section under the “Life Cycle” collection and the “Engagement Topic” that we applied it to.
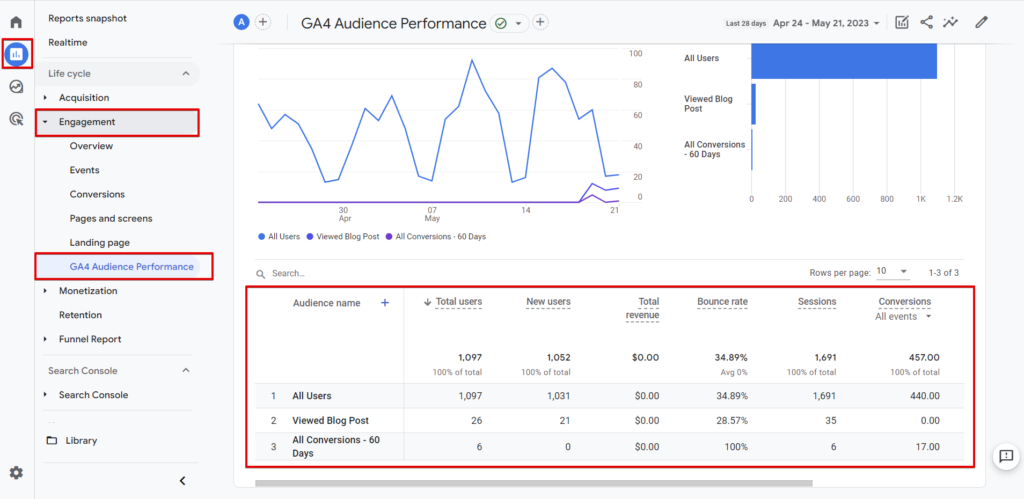
It is important to note that the column totals in your table report may not always represent the overall totals for the website. This is because certain metrics reflect aggregated values for each audience segment. It is also essential to consider audience overlapping, which means that a user can belong to multiple audience segments simultaneously.
Building An Audience Performance Exploration Reports In Google Analytics 4 (GA4)
There are a couple of detailed approaches that can be taken to create a similar exploration report.
Option 1:
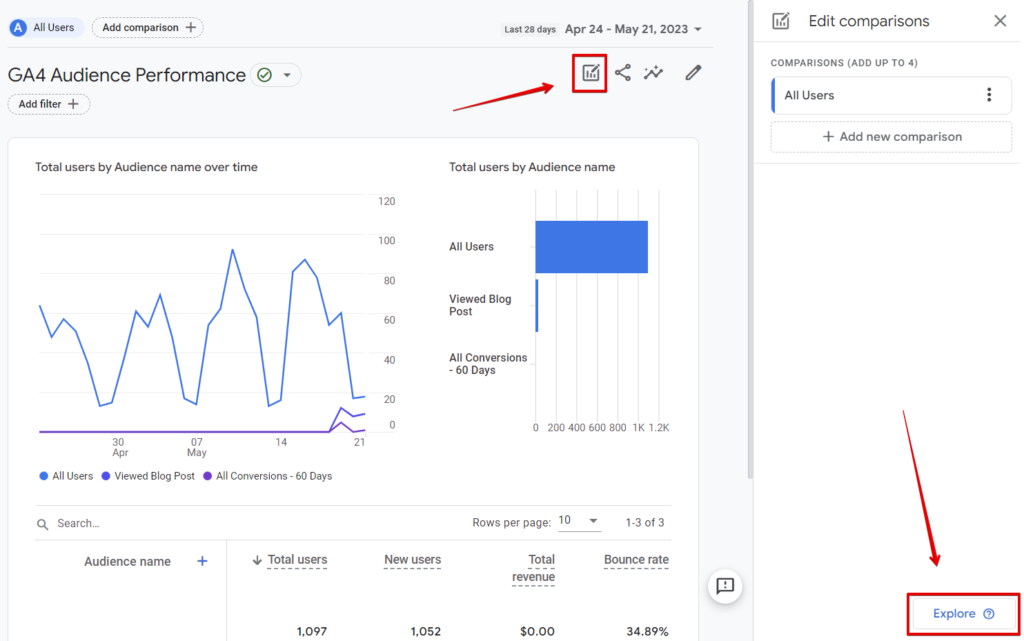
If you already have a standard report created, you can save time by leveraging it. Access the standard report you created earlier, click the “comparison” icon, and then select the “Explore” option at the bottom. This action automatically generates the exploration report for you based on the existing standard report.
Option 2:
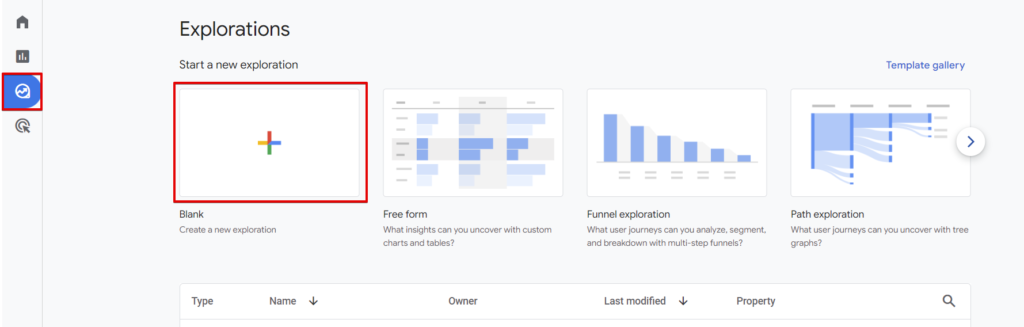
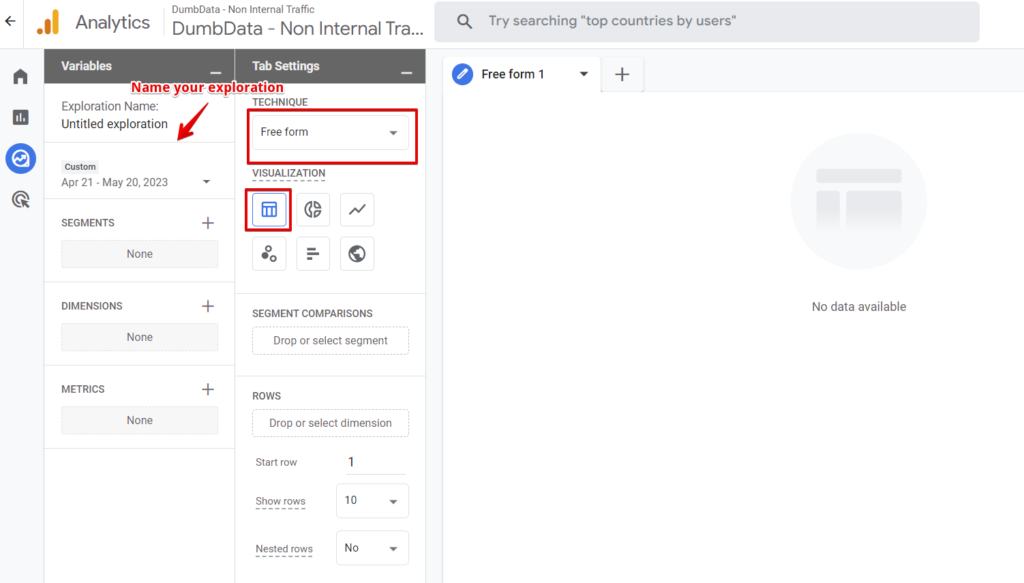
Alternatively, you can manually create the exploration report. Begin by navigating to the “Explore” section in your GA4 interface and clicking the plus icon to create a blank exploration report from scratch.
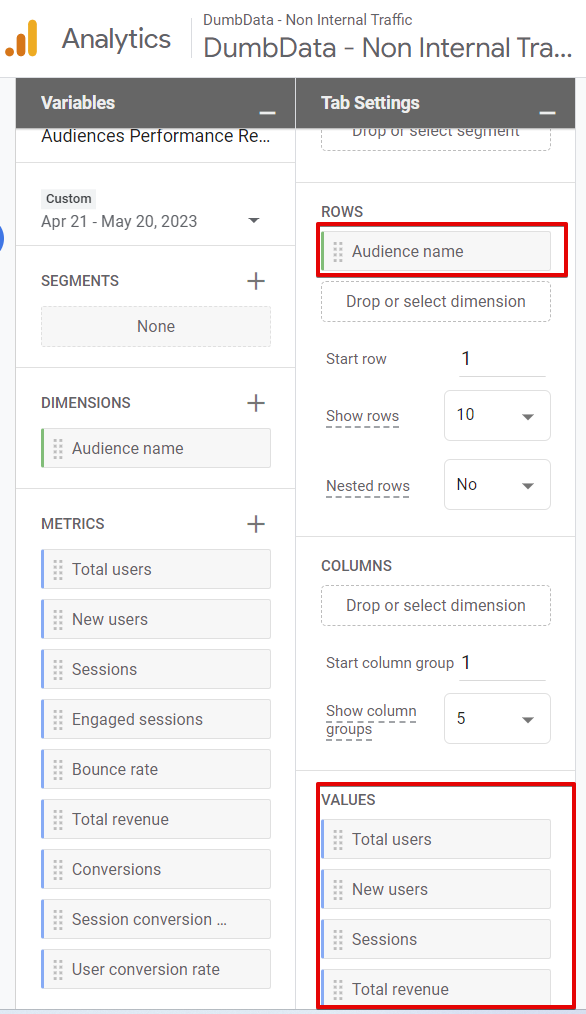
Ensure your reporting technique is “Free Form” and choose the visualization type as “Table”. Once these settings are established, proceed to add the “Audience Name” dimension and the relevant metrics you wish to include in your audience performance exploration report.
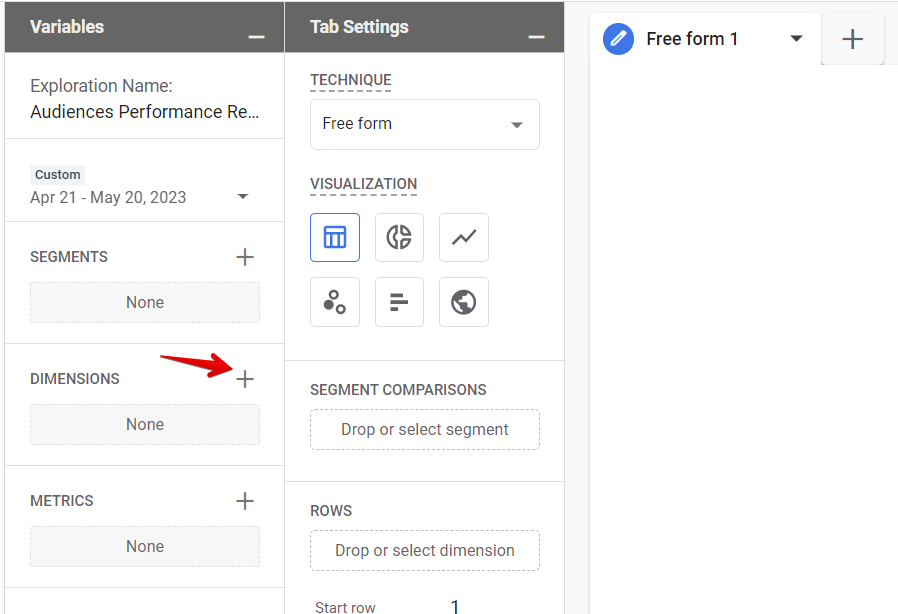
Click the plus sign to import the “Audience Name” dimension to your exploration report variables section.
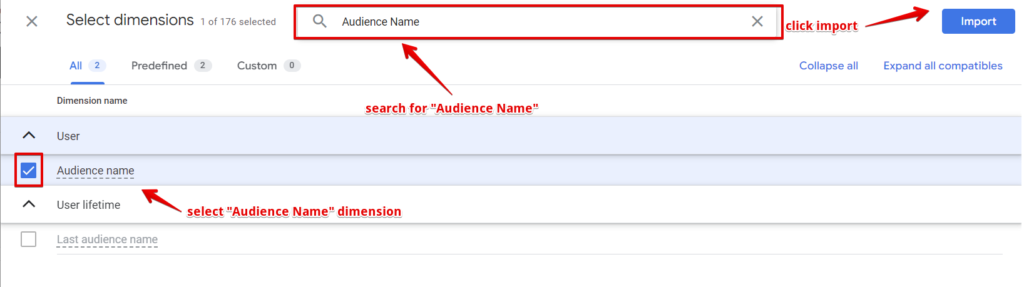
Use the search bar to find, select the “Audience Name” dimension, and click the “Import” button.
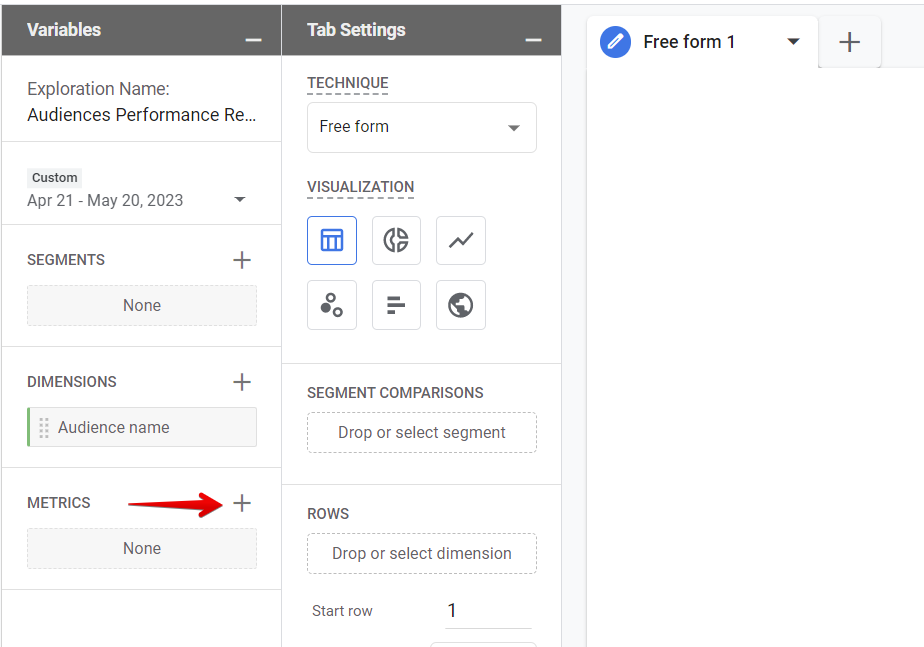
Click the plus sign to open the metrics selection view.
Import your metrics to the exploration report.
In the “Tab Settings” panel, assign the dimension to the “Rows” section and place the metrics in the “Values” section. After configuring the layout, giving your exploration a descriptive name is essential. This way, other users with access to your GA4 property can easily understand the purpose of the exploration report.
By following either of the above-laid-out options, you can create an exploration report that allows for a deeper analysis and understanding of your audience’s performance in GA4.
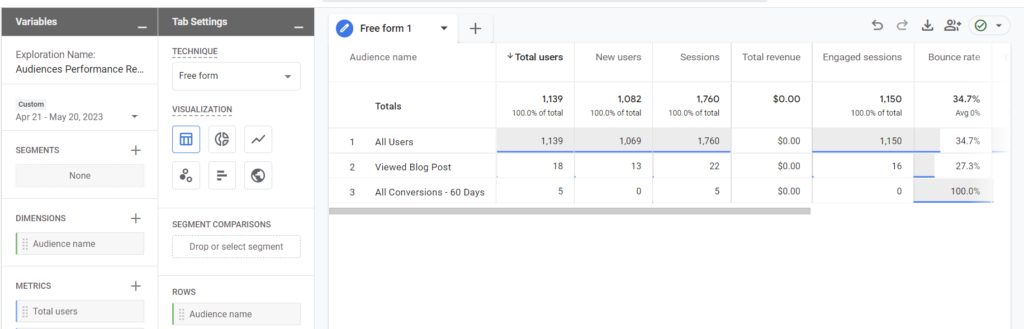
Here is another similar report using the GA4 demo store data.
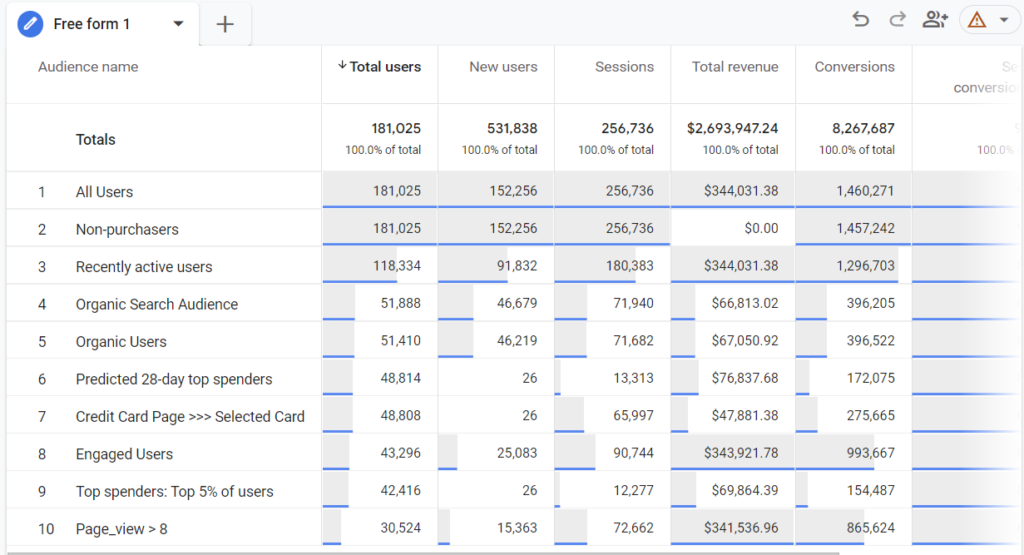
As we mentioned in the detailed standard report, it will be helpful to understand that the column totals in your exploration reports do not always represent the overall totals for the website. The same principle applies here as well. The column totals in the exploration reports reflect the aggregated metrics for certain metrics in the table. It’s also essential to take into account audience overlapping. Remembering this when interpreting the totals in your exploration reports is essential.
The Conclusion:
Although this blog post turned out to be longer than expected, we have delved into key aspects surrounding audiences in Google Analytics (GA4). We have explored the definition of audiences, examined the GA4 audience report, identified its limitations, and highlighted the reporting flexibility provided by GA4 through standard and exploration reports.
If you found this topic intriguing and want to explore further data collection strategies and optimal utilization of analytics tools, I recommend subscribing to our newsletter. You’ll only receive our newsletters when we have something helpful to share with you, such as when a new article or resource gets published on the DumbData website. Subscribing will keep you updated with our latest insights and valuable resources.