


Piwik Pro offers four product modules: Analytics, Tag Manager, Customer Data Platform, and Consent Manager. Today, we’ll focus on the Analytics and Consent Manager suites. I’ll demonstrate some consent-related calculations you can perform in Piwik Pro using “Calculated Metrics”, provided you’re using the native Piwik Pro Consent Management Platform or have integrated a third-party CMP with Piwik Pro. I’ll also briefly cover a use case for building an enhanced privacy reporting dashboard to understand user interactions with your consent banner.
Using Piwik Pro, you can seamlessly collect and analyze consent banner interactions to answer performance-related questions that require extra calculation. This includes calculating consent rates, opt-in rates, decline rates, implied non-consent, and more.
To leverage Piwik Pro for insights into how users interact with your website’s consent banner, you need to run specific calculations to gain insights into the banner’s engagement and performance. You need to have met the following requirements;
- You must use either the native Piwik Consent Manager or have integrated your chosen Consent Management Platform (CMP) with Piwik Pro.
- The Piwik Pro tracking script must be installed on your website.
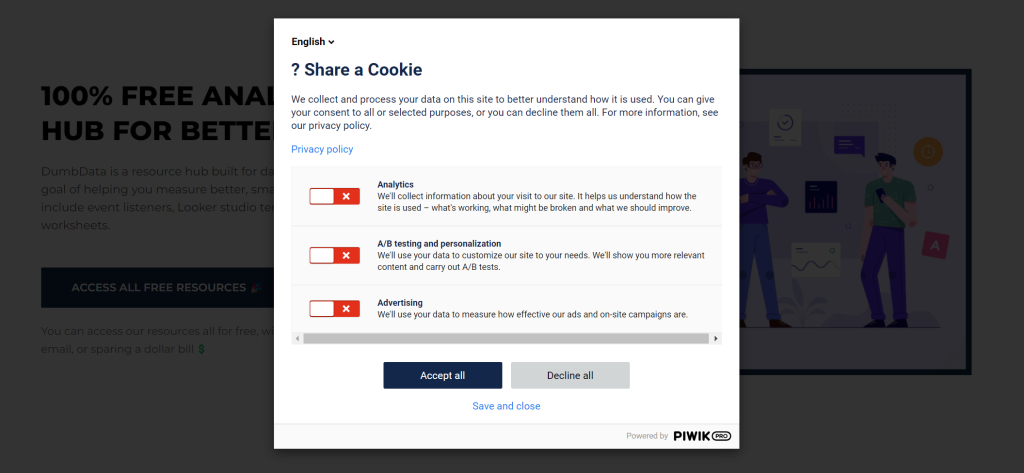
- Your website visitors must see a consent banner.
Refer to our Piwik Pro consent integration series if you’re using a third-party CMP and need to integrate it with Piwik Pro. This series provides solutions for integrating CMPs such as Osano, CookieYes, and CookieFirst with Piwik Pro. You can also check the Piwik Pro integration page for other compatible CMP vendors.
Now, let’s go into the main content of this blog post. I’ll show you how to use Piwik Pro to build a better consent banner engagement reporting dashboard and answer key consent questions, such as opt-in rates, decline rates, consent rates, and the total number of users who have provided consent preferences, including at least one consent type.
This article is divided into two sections: calculations using “Piwik Pro Calculated Metrics” and dashboarding using the “Dashboard” reporting surface. While I won’t go into detailed builds, the process is straightforward and something you can easily accomplish on your own.
Using Piwik Pro To Answer Consent Banner Performance-Related Questions
Privacy is becoming an important piece of our work as marketers and analysts, making compliance essential in collecting, managing, processing, and using customer data.
One critical step in ensuring compliance is the implementation of consent banners, popularly known as cookie banners. Suppose you have implemented a consent banner using the native Piwik Pro CMP or a third-party vendor integrated with Piwik Pro. You might want to analyze its performance and interaction metrics. Here are some key questions we will address:
- Consent Banner Non-Interaction Rate
- Consent Rate of the consent banner on your website
- Opt-in Rate (both full consent opt-in and at least one consent type opt-in)
- Consent Decline Rate of the consent banner you’ve on your website
- Number of Opt-ins (at least one consent type is given)
- Number of Implied No Consent Actions
You might wonder why you should use Piwik Pro to answer these questions when your CMP platform can provide (some of) the answers. The reason is that you might not have access to the client’s CMP account, and sometimes, the metrics I have highlighted above aren’t available in the UI and require extra export and transformation.
However, with Piwik Pro integration, you can still generate comprehensive reports on consent banner performance. Additionally, Piwik Pro offers more granular insights and reporting flexibility regarding user interactions with your website’s consent banner, which I show you soon.
Piwik Pro already collects and reports on many useful consent metrics and dimensions, such as:
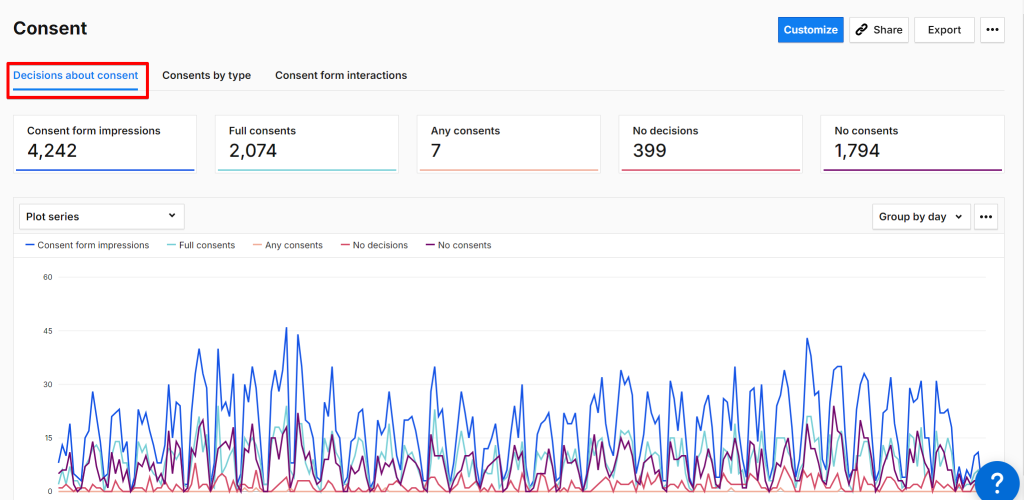
- Consent Form Impressions: The number of times the consent form was displayed to website visitors.
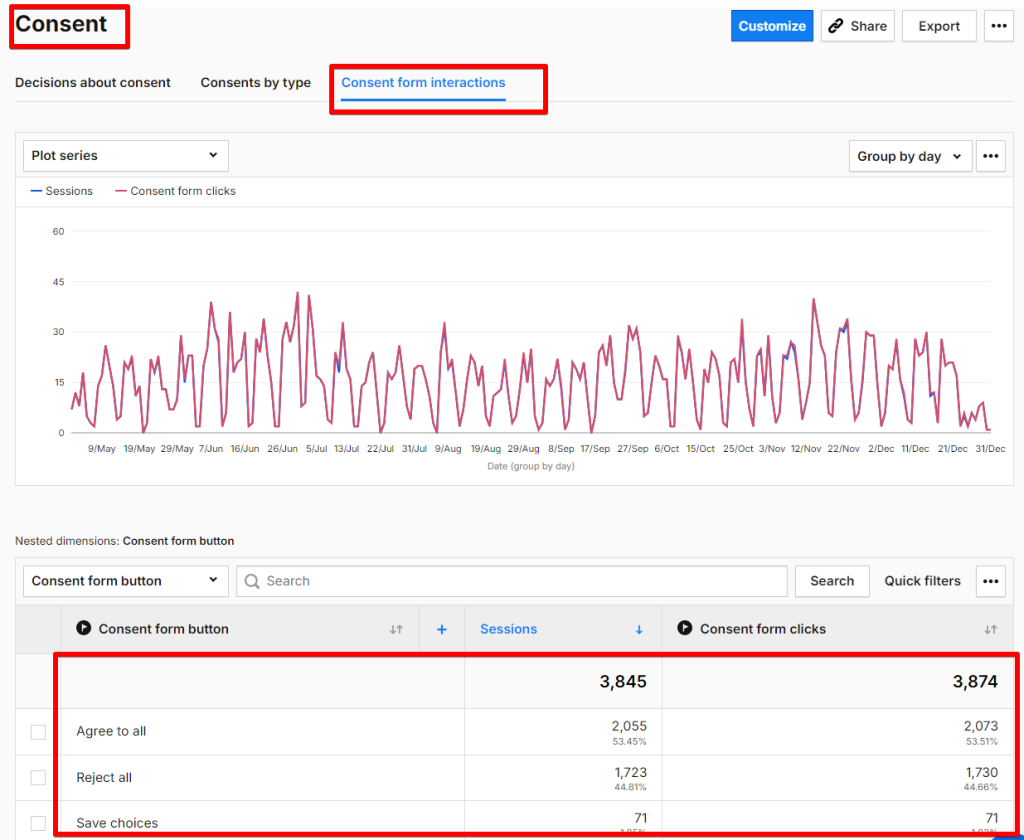
- Consent Form Clicks: The number of clicks on buttons on the form, such as accept all, reject all, save choices, or close.
- Any Consents: The number of visitors who accepted one or more consent types but not all of them.
- No Consents: The number of visitors who didn’t consent to anything.
- No Decisions: The number of visitors who ignored the consent form without making any decision.
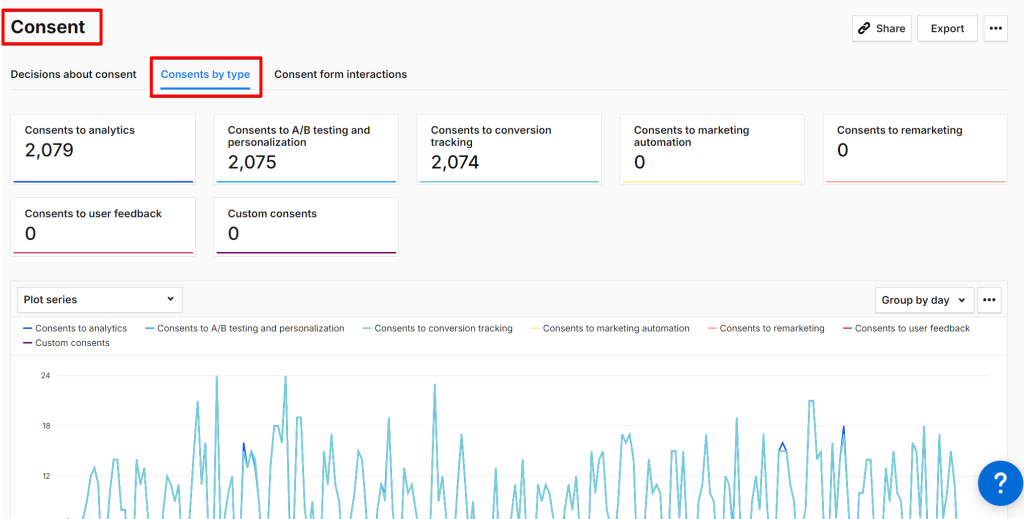
Additionally, Piwik Pro provides insights into how often specific consent categories are included in user preferences. These categories include Analytics, A/B Testing, Conversion Tracking, Remarketing, Marketing Automation, and User and Custom Consent, provided these options are available on the consent banner.
For more details on consent-related metrics and dimensions, you can refer to the following resources:
We can use calculated metrics to answer the consent-related questions we highlighted earlier, which are not directly listed among Piwik Pro’s metrics and dimensions. By leveraging the existing metrics in Piwik Pro Analytics to create calculated metrics, you can derive the necessary insights to comprehensively understand and report on your consent banner’s performance.
How To Use Calculated Metrics In Piwik Pro For Custom Consent Calculations
First, let’s briefly highlight what calculated metrics mean in Piwik Pro Analytics.
Calculated metrics in Piwik Pro allow you to create custom metrics from existing ones, combining metric and dimension values using equations (addition, subtraction, multiplication, or division) to create new metrics that can be expressed as a number, percentage, or ratio.
To find calculated metrics in Piwik Pro, navigate to the “Settings” view in the Piwik Pro analytics suite. On the left, under the “App Settings” section, you’ll see “Calculated Metrics.”
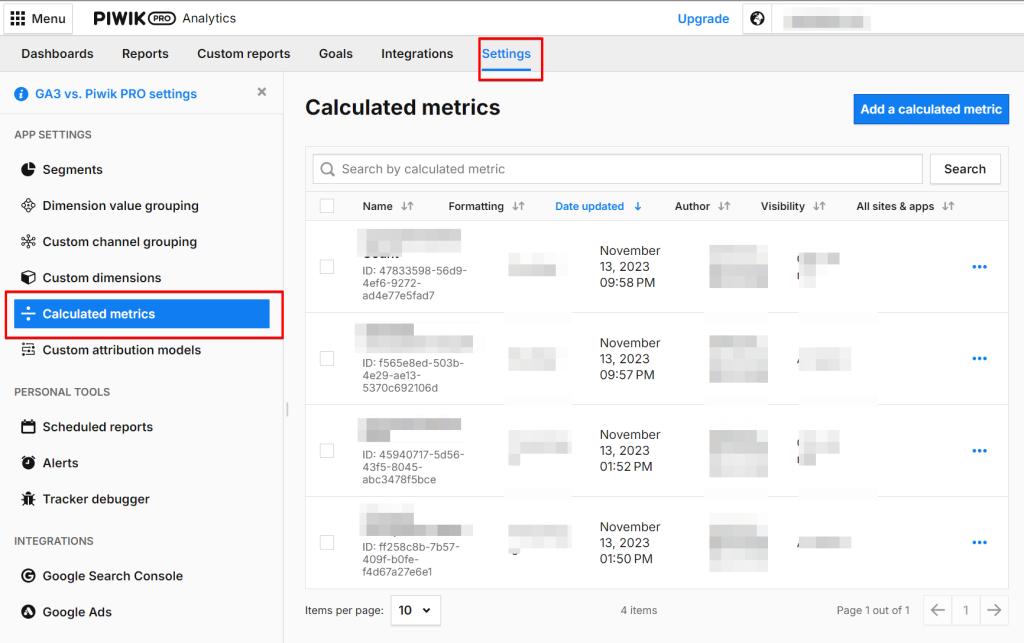
When you click on it, you’ll see all previously created calculated metrics and a button to create a new one. If you haven’t created any, this section will be blank.
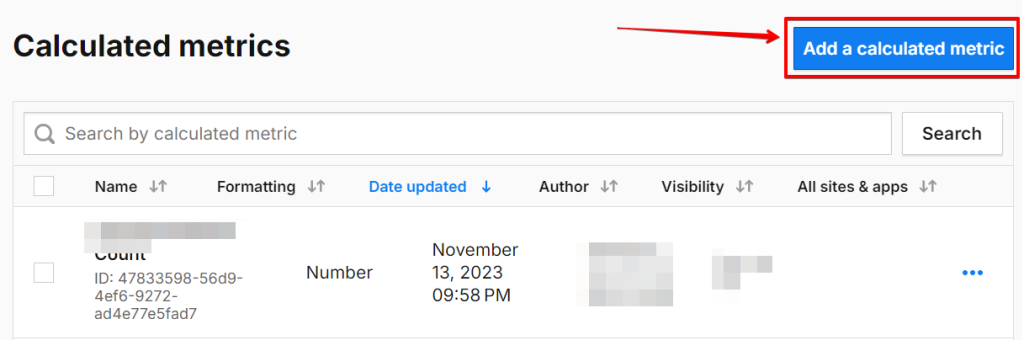
Click the “Add a new calculated metric” blue button to create a calculated metric. This opens the calculated metric configuration view.
In the calculated metric panel, you’ll need to:
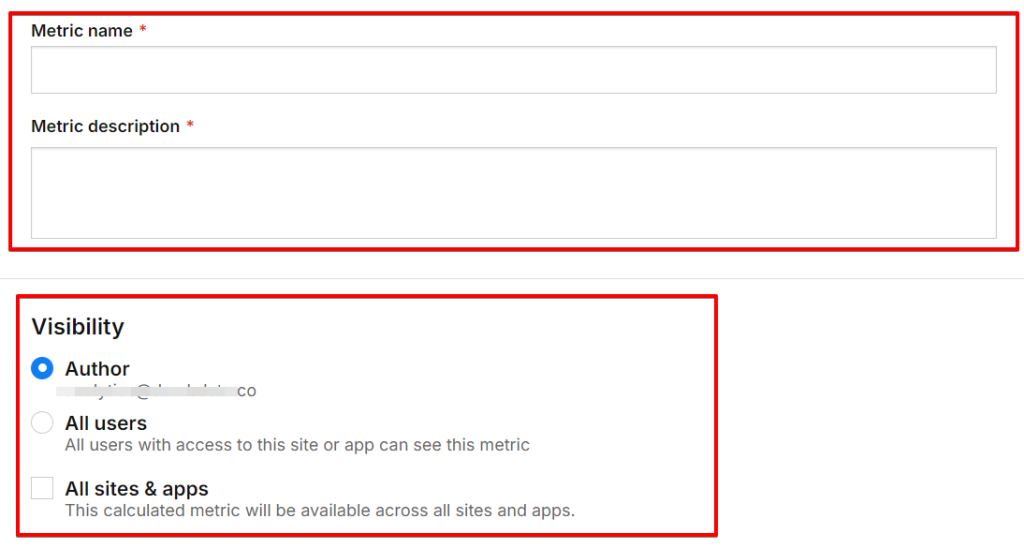
- Add a Name: Give your calculated metric a descriptive name.
- Provide a Description: You can add more context here.
- Select the Custom Metric Visibility Type:
- Author: Makes it visible only to you.
- All Users: Makes it visible to everyone with access to the Piwik Pro property.
You can add the calculated metric to all Piwik Pro Analytics account properties if you have multiple properties under your account.
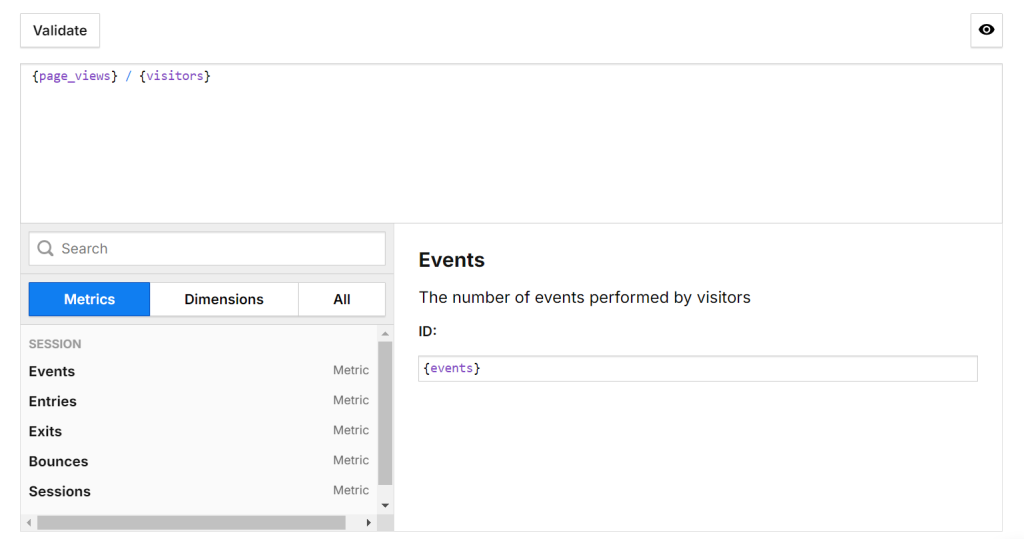
Next, you can add your formula, which includes metrics and the allowed arithmetic operators.
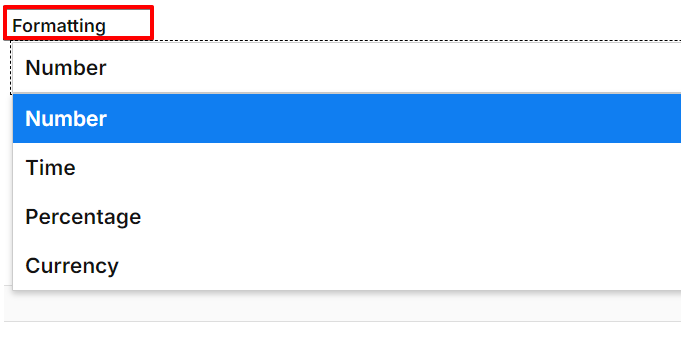
After adding the formula, select the metric format type, which can be one of the following:
- Number
- Time
- Percentage
- Currency
There is also an optional “Show percent of the total in reports” checkbox, allowing you to choose whether to show or hide the percentage of the total in reports.
Here are a few key points about calculated metrics in Piwik Pro:
- You can edit and delete a calculated metric you’ve created.
- You cannot use a calculated metric within another calculated metric.
- You can use calculated metrics in custom reports and dashboards inside Piwik Pro.
- You can configure a calculated metric to be visible only to you or to other individuals with access to the Piwik Pro site instance.
- Supported equation types include addition, subtraction, multiplication, and division.
- Piwik Pro allows you to cast a dimension as a metric for your reporting.
- Calculated metrics in Piwik Pro are retroactive, meaning they apply to historical data.
- The description you add will appear in the metric tooltip.
- You can copy a calculated metric to a new analytics property.
- The rules of PEDMAS (Parentheses, Exponents, Multiplication and Division, Addition and Subtraction) and BODMAS (Brackets, Orders, Division and Multiplication, Addition and Subtraction) apply. Piwik Pro first handles calculations in brackets, followed by division, multiplication, addition, and subtraction.
Creating Consent-Related Metrics Using Piwik Pro Calculated Metrics
Let’s explore how to create calculated metrics for consent reporting and gain insights into consent banner performance and interaction activities.
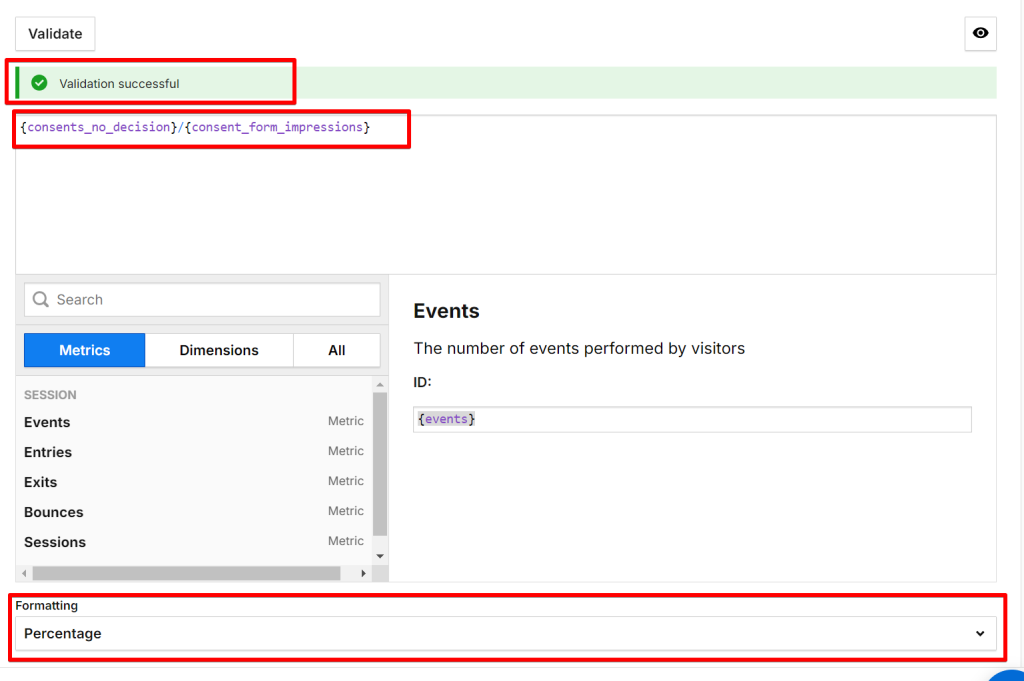
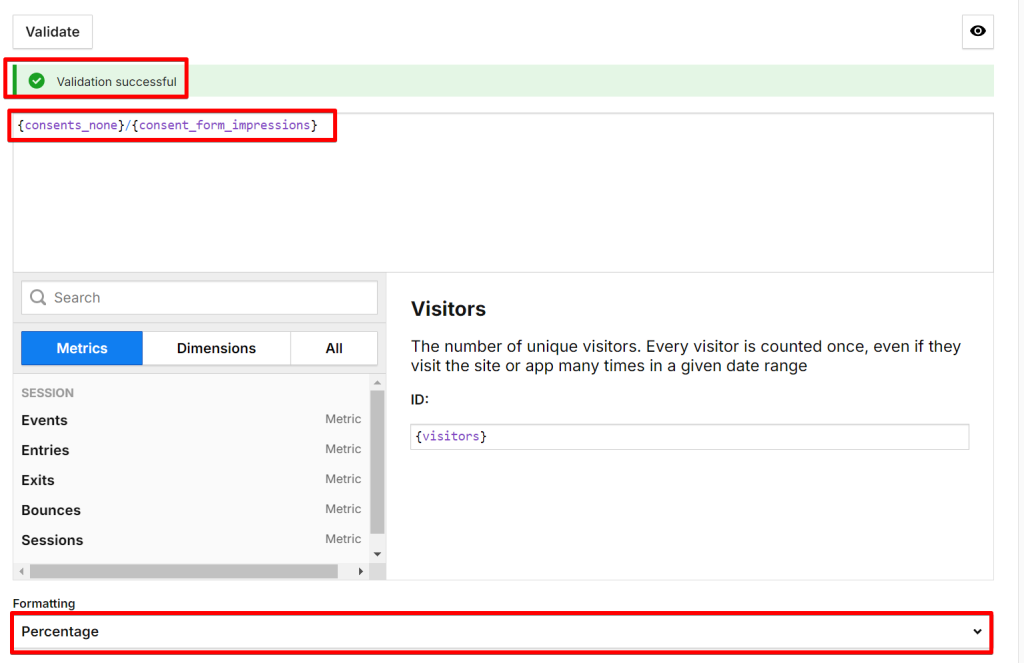
Consent Banner Non-Interaction Rate:
This metric represents the percentage of website visitors who saw a consent form but did not make any choices, essentially ignoring the consent form.
The Calculated Metric Formula:
{consents_no_decision}/{consent_form_impressions}Formatting Type: Percentage
Consent Rate:
This metric provides the percentage of users who have given consent (opt-in) out of all users who responded to the consent banner notice. This can be subdivided into:
- Full Consent Rate: Full opt-in consent was given.
- Partial Consent Rate: At least one consent type was given.
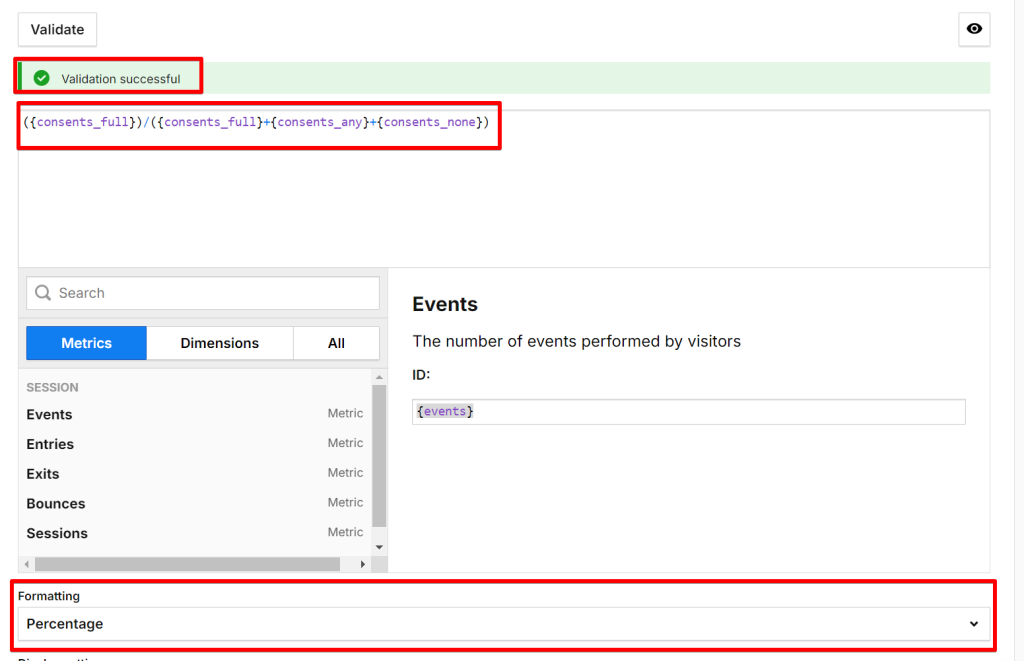
Full Consent Rate:
The formula is the division of the Full Consents metric by the summation of the following metrics: Full Consents, Any Consents, and No Consents.
The Calculated Metric Formula:
({consents_full})/({consents_full}+{consents_any}+{consents_none})Formatting Type: Percentage
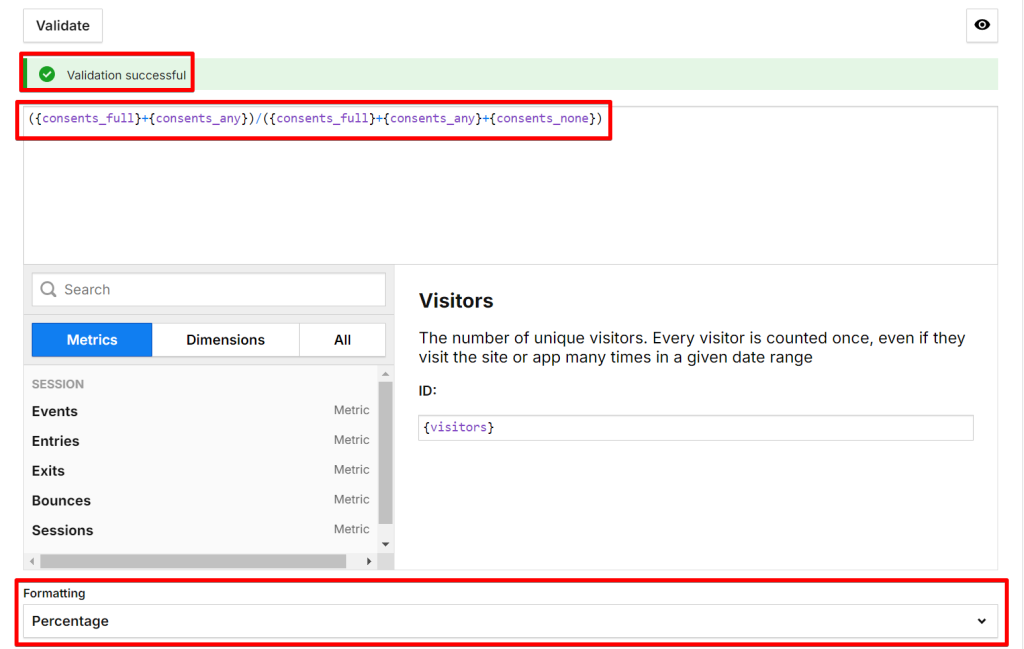
Partial Consent Rate:
The formula is the addition of the Full Consents and Any Consent metric, which is then divided by the summation of the following metrics: Full Consents, Any Consents, and No Consents metrics.
The Calculated Metric Formula:
({consents_full}+{consents_any})/({consents_full}+{consents_any}+{consents_none})Formatting Type: Percentage
Opt-in Rate:
This metric shows the percentage of users who have given consent (opt-in) out of the total number of times a consent banner is shown. This can be subdivided into:
- Full Opt-in Rate: Full opt-in consent was given.
- Partial Opt-in Rate: At least one consent type was given.
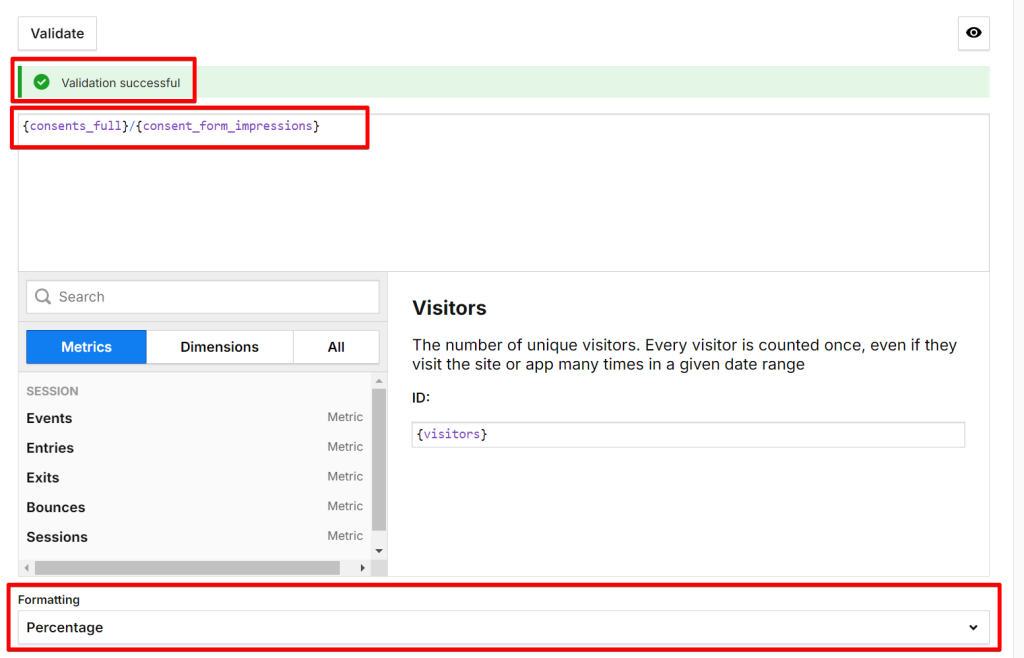
Full Opt-in Rate:
{consents_full}/{consent_form_impressions}Formatting Type: Percentage
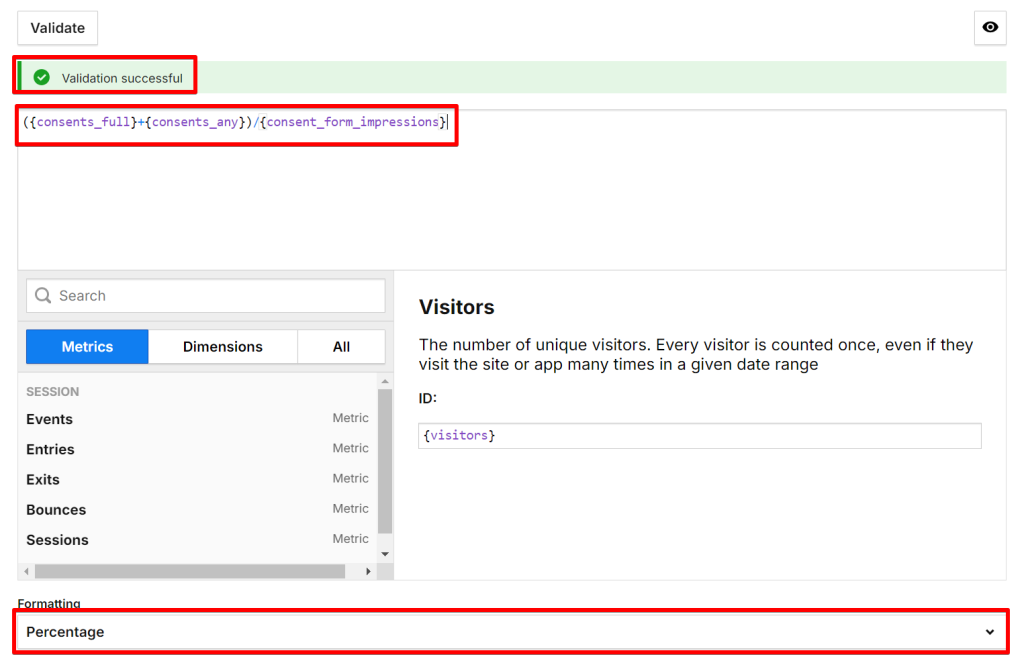
Partial Opt-in Rate:
({consents_full}+{consents_any})/{consent_form_impressions}Formatting Type: Percentage
Consent Decline Rate:
This metric shows the percentage of users who did not give consent (opt-out) out of the total number of times a consent banner is shown.
The Calculated Metric Formula:
{consents_none}/{consent_form_impressions}Formatting Type: Percentage
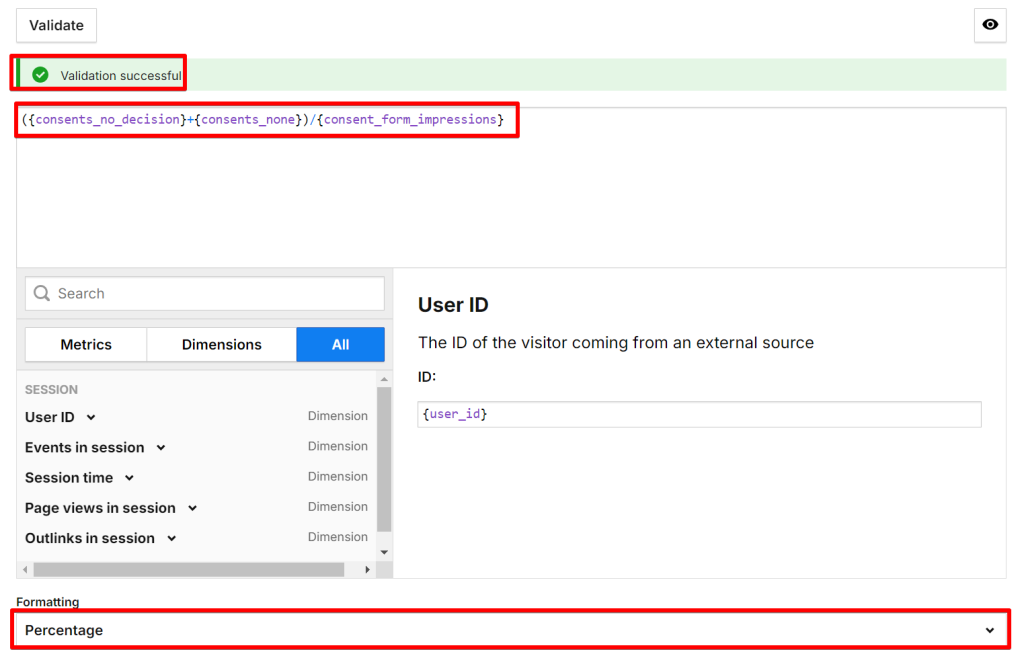
To include “No Implied Consent” scenarios where users made no consent choices as a decline:
The Calculated Metric Formula:
({consents_no_decision}+{consents_none})/{consent_form_impressions}Formatting Type: Percentage
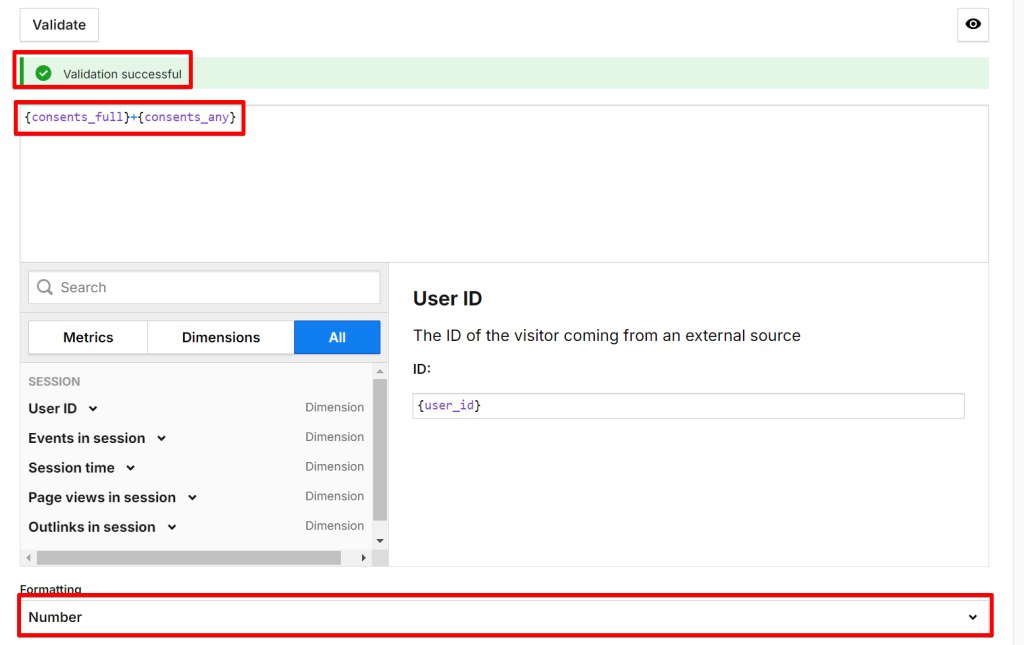
Total Number of Opt-ins (At Least One Consent Type Given)
Piwik Pro provides the number of users who gave full consent and the “Any Consent” metric, which indicates the number of visitors who accepted one or more consent types but not all.
To know the total number of full and partial opt-ins, use the calculated metric functionality.
The Calculated Metric Formula:
{consents_full}+{consents_any}Formatting Type: Number
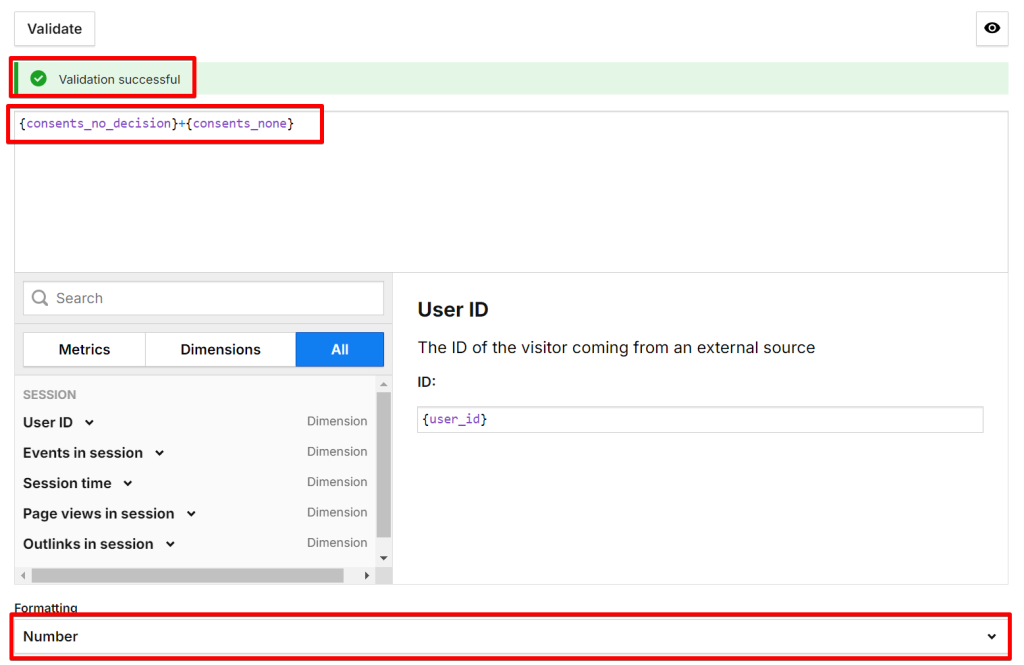
Number of Implied No Consent (No Decisions and No Consents)
This metric helps you understand the number of situations where consent is not explicitly given, either by the absence of clear permission (no decision) or by an explicit refusal to provide consent.
The Calculated Metric Formula:
{consents_no_decision}+{consents_none}Formatting Type: Number
Now that you’ve seen how calculated metrics in Piwik Pro can help you create these custom consent metrics. The following section of this blog post discusses how to use them for reporting.
Remember that these custom metrics are only usable in custom reports and dashboards. We will cover the reporting aspect in the next section.
How to Build and Enhanced Consent Performance Reporting Dashboard In Piwik Pro
Piwik Pro offers a native consent report that is accessible from the “Reports” tab. Click on the “Consent” report under the “Audience” section. The report includes three tabs:
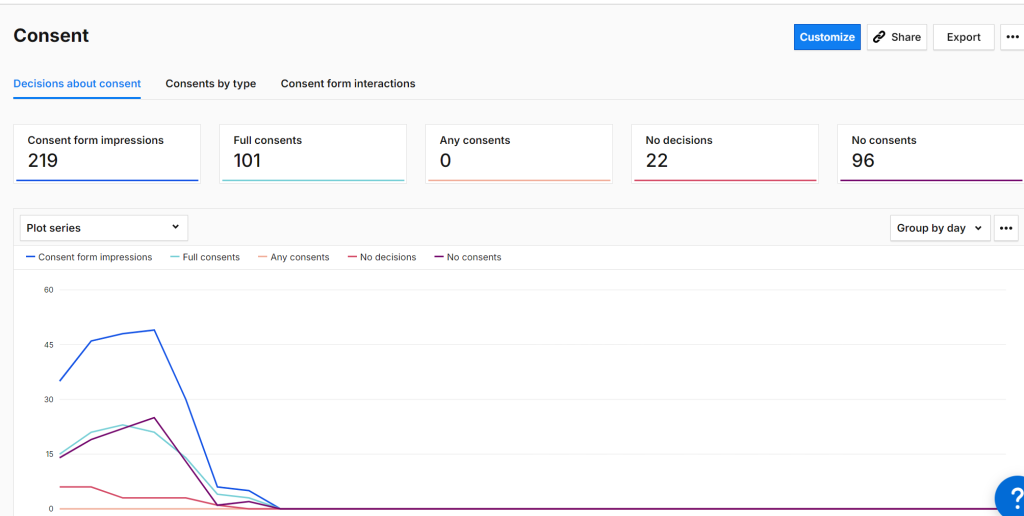
1. Decisions about Consent:
This tab provides aggregated information on the decisions users made through your consent banner and the number of impressions your consent banner received. It includes a time series chart to monitor trends and changes in any of the consent-related metrics.
2. Consents by Type:
This tab offers insights into the number of times different consent categories in Piwik Pro are included in user preferences.
3. Consent Form Interactions:
This tab provides insights into user click activities on the consent banner.
However, this report does not allow you to add the custom metrics you’ve created. Using the “Customize” button to include your metric creates a new “custom report.” Depending on your needs, you can either create custom reports for all your consent banner interactions and performance questions or utilize the dashboard feature of Piwik Pro Analytics.
Creating Custom Dashboards For Reporting on the Performance of Your Website Consent Banner
To create a custom report or dashboard:
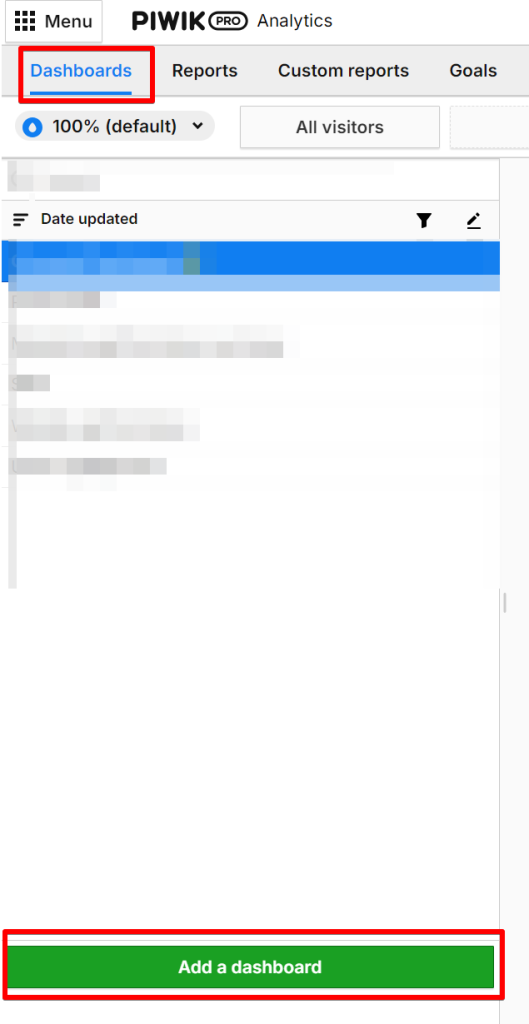
1. Navigate to the “Dashboards” section in Piwik Pro Analytics.
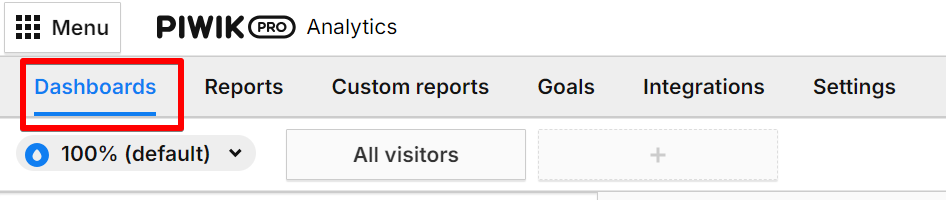
2. Click the “Add a dashboard” button to create a new dashboard.
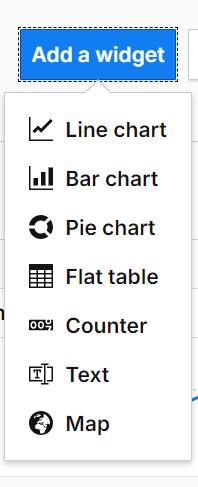
Use the following widgets to build your dashboard:
- Line chart
- Bar chart
- Pie chart
- Flat table
- Counter
- Text
- Map
Here’s an example of how you might structure your dashboard; I used different sections to help me understand how the consent banner on the DumbData website is performing.
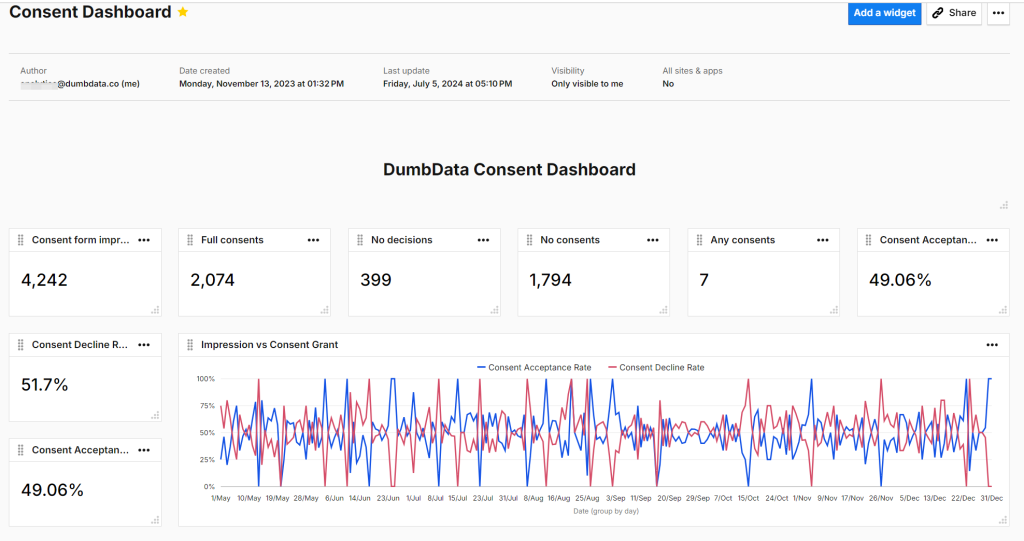
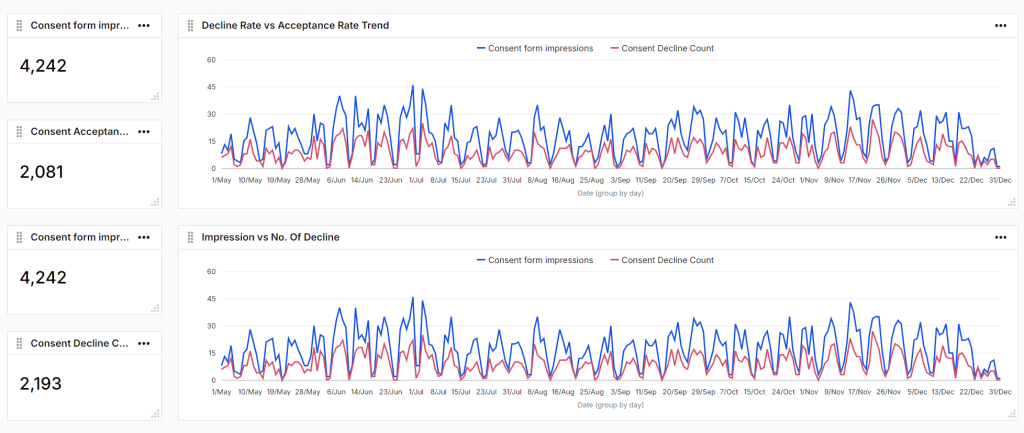
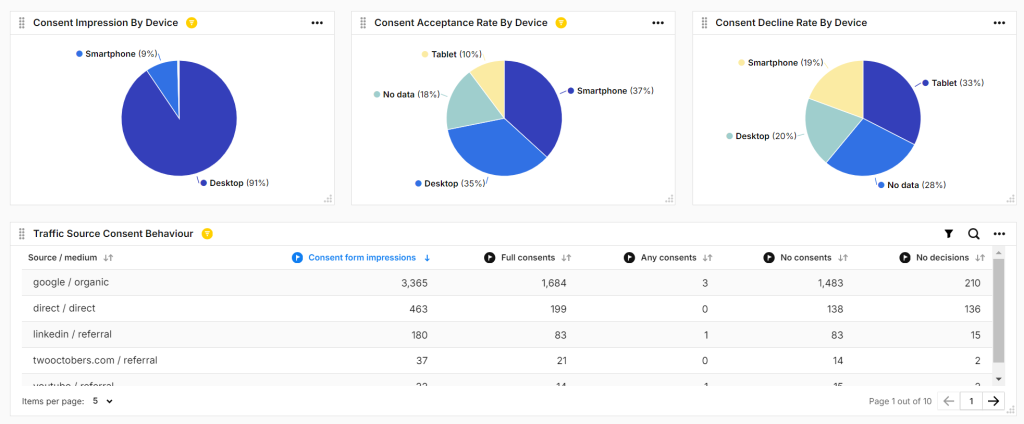
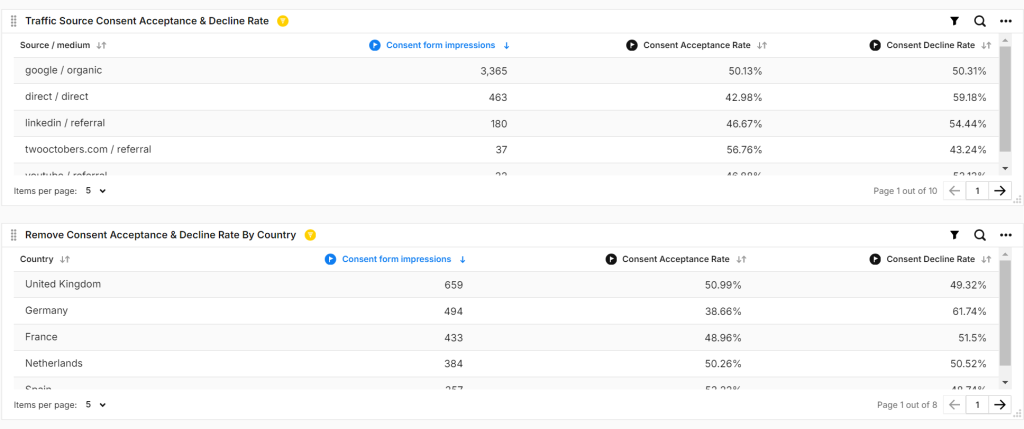
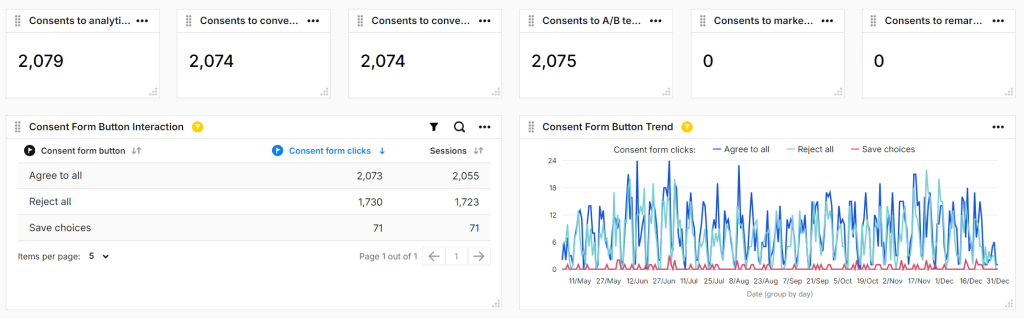
Note that in my case, some charts have filters applied to them.
Creating a dashboard is straightforward. If you need more information on using Piwik Pro dashboards, you can watch the embedded video or read the documentation provided by Piwik Pro.
Closing Thoughts
We have explored how Piwik Pro can address various consent-related questions. This blog post demonstrated how to use calculated metrics to create custom consent-related metrics in Piwik Pro Analytics.
We introduced calculated metrics, explained where to find this functionality in your Piwik Pro property, and highlighted what you can achieve with this feature.
I also provided a detailed walkthrough on creating custom metrics using Piwik Pro’s calculated metrics to answer specific consent questions. Additionally, we covered how to locate the native consent report and enhance your reporting using Piwik Pro dashboards for your business or clients.
Being innovative will be a valuable asset, as it opens the possibility of strategically creating any calculated metric not covered in this blog post to address specific privacy-related business questions, provided it’s possible in Piwik Pro Analytics.
Please note that you use the available slots for calculated metrics as you create these custom metrics.
I would love to know what you learned from this blog post. If you have any feedback or if there is anything I missed, please reach out to me via the info or form on the DumbData Contact Us page or via LinkedIn. I look forward to hearing your thoughts.