Welcome to another episode of the Mixpanel series! In this short guide, I’ll discuss how to leverage Mixpanel’s reporting capabilities to answer time-related marketing, business, and product performance questions, with a focus on the “Time of Day” and “Day of the Week” dimensions.
You will also gain insights into using Mixpanel to address performance-related questions tied to time.
A brief backstory about the Mixpanel Series: It began after Mixpanel announced its focus on including Marketing Analytics in its product. This prompted the creation of guides on how to use the product, with a major emphasis on reporting. In the previous episode, I touched upon conversion reporting in Mixpanel, which you can read about here.
Our focus will be on using Mixpanel to understand how your product is used and its performance during different times of the day and days of the week.
Time of Day reports and Day of Week reports in Mixpanel can provide valuable insights, such as:
- Identifying the busiest and inactive days of the week and hours of the day for your product. This information is crucial for developing future marketing and promotional strategies.
- Gaining insights into when your users are most likely to perform a conversion action.
- Determining the best days of the week and times of day to launch new features, products and promotions based on peak user activity.
- Understanding which days of the week your website generates the most traffic and completion of your product funnel plus provides an overall weekly pattern of your customers.
This data can help you create accurate company performance summaries and overviews of your product, marketing, and sales efforts. By analyzing peak visiting hours, you can optimize the timing of new promotions and product launches to drive sales.
Let’s go straight into building the report.
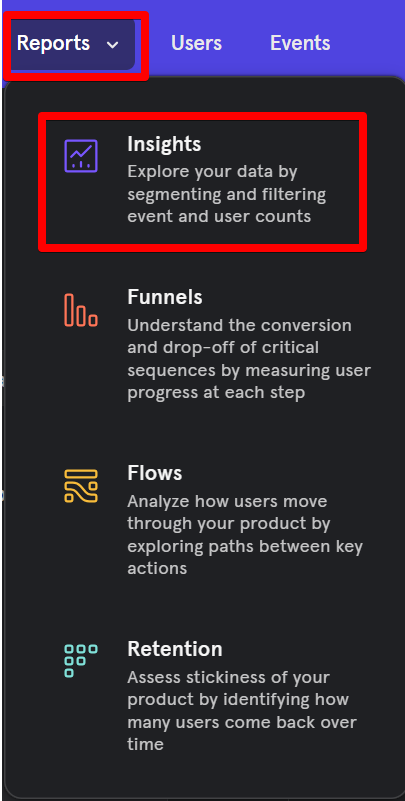
Start by clicking the Reports option and selecting the “Insights” report type.
You should also change the data display type from a “Line” chart to a “Table” chart.

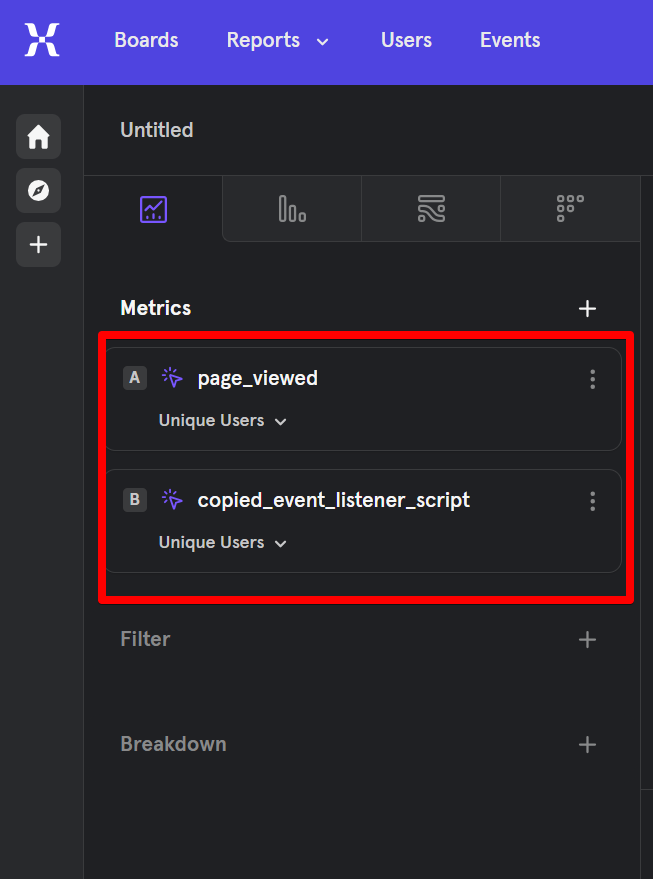
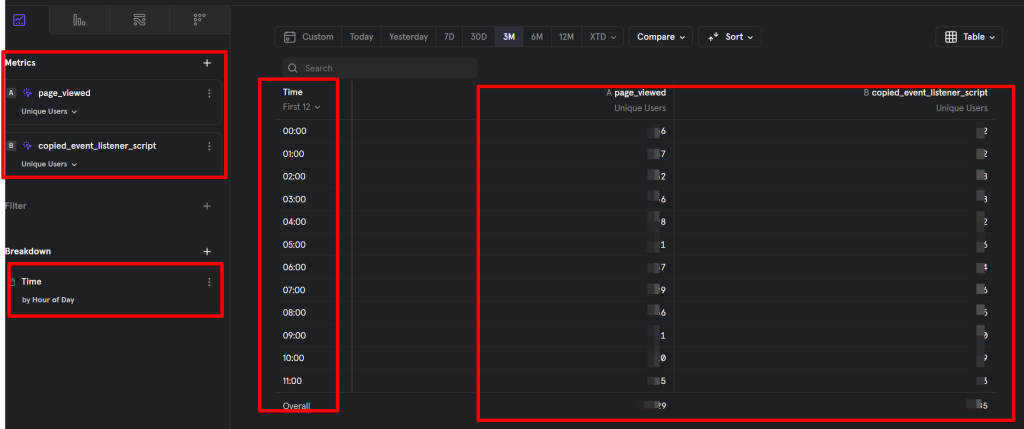
Next, add your events or groups of events. In this example, I selected the following events:
- page_view
- copied_event_listener_script
To understand performance by the hour of the day and day of the week, you need to break down the report by the “Time” property.
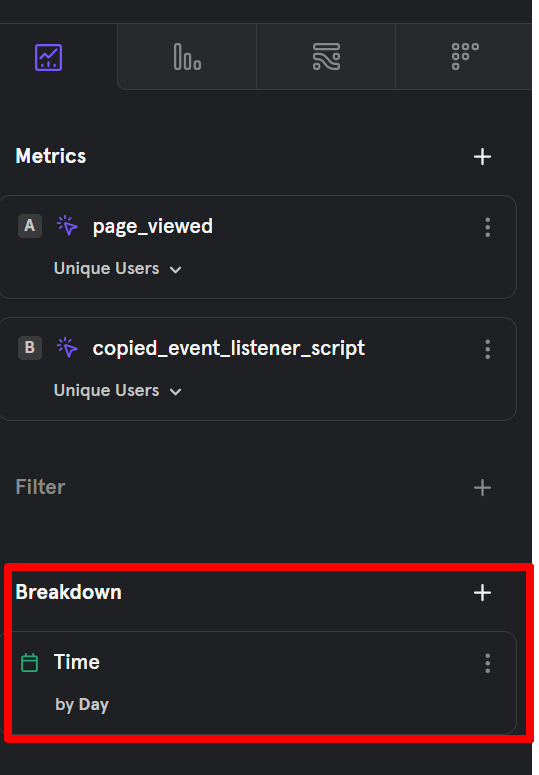
Time is an event property you can send, or Mixpanel can include it as an event property for you using the time of data collection.
A Unix time epoch determines the time of an event. If no time property is provided at the time of the event being collected, Mixpanel will use the time the event arrives at their servers.
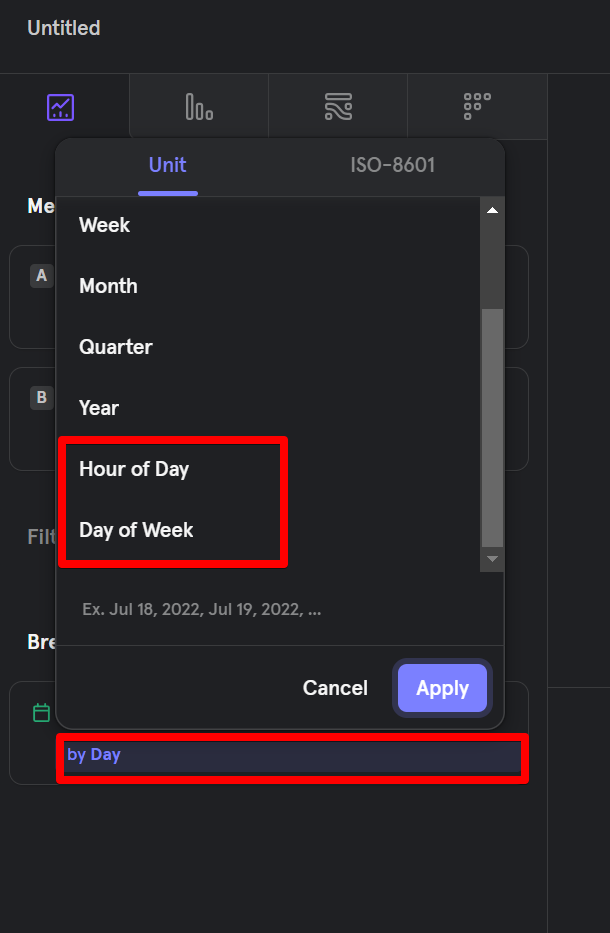
Next, click on the “Time” event property. Under the “Unit” tab, you’ll find several options to shift your focus in time. Select “Hour of Day” or “Day of Week” based on your reporting needs.
Now you’ll be able to measure and gain insights into the best-performing hours of the day and days of the week.
Example of the day of the week report in Mixpanel.
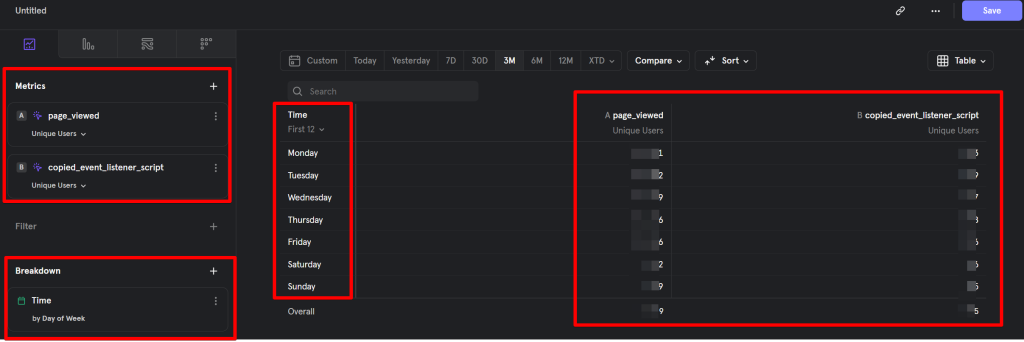
Keep in mind that the time reported uses the timezone selected in your Mixpanel project settings.
There are various ways to use the time event property, and I encourage you to explore them further by being innovative with how you can use them to answer valuable product, marketing and business questions.
I know this article from the Mixpanel series I started in 2023 might be brief, but I do hope it has shown you how Mixpanel can help you answer performance questions centred around the hour of the day or day of the week.
Please let me know what you think. If you feel there’s anything I’ve missed in this article, feel free to reach out to me via LinkedIn or the DumbData team email. Until then, happy measuring!


